Segment Spleen in Hyperspectral Image of Porcine Tissue
This example shows how to segment a spleen in a hyperspectral image of porcine tissue.
Hyperspectral images provide significant information about the quality and composition of the imaged materials. This makes hyperspectral imaging a useful tool for non-invasive medical applications, such as segmenting organs.
This example requires the Hyperspectral Imaging Library for Image Processing Toolbox™. You can install the Hyperspectral Imaging Library for Image Processing Toolbox from Add-On Explorer. For more information about installing add-ons, see Get and Manage Add-Ons. The Hyperspectral Imaging Library for Image Processing Toolbox requires desktop MATLAB®, as MATLAB® Online™ and MATLAB® Mobile™ do not support the library.
Load Data
This example uses one hyperspectral image of porcine spleen tissue from the Heidelberg Porcine HyperSPECTRAL Imaging Dataset [1] [2]. Download and unzip the data set.
zipFile = matlab.internal.examples.downloadSupportFile("image","data/porcineSpleenHyperspectralData.zip");
filepath = fileparts(zipFile);
unzip(zipFile,filepath)
Visualize Data
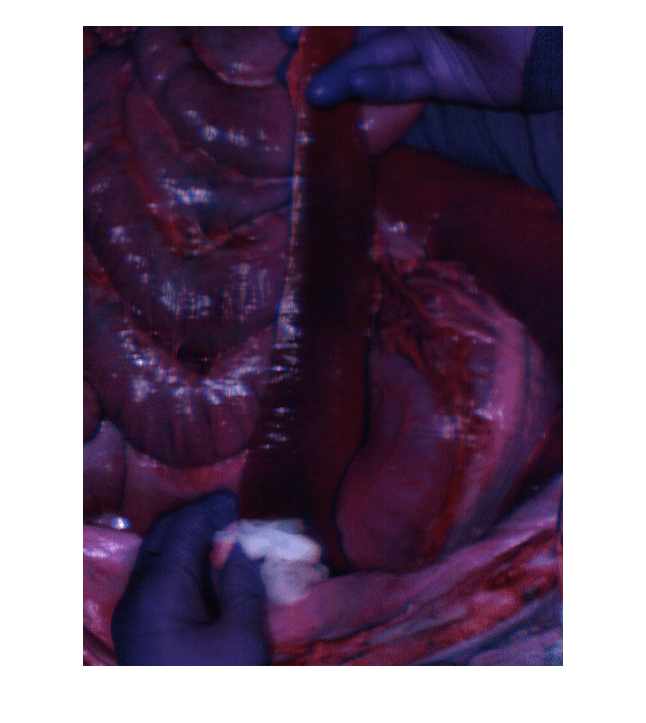
Load the hypercube into the workspace. Visualize the spleen as an RGB image. Observe that there are at least four distinct classes in the image: the hands of the lab personnel, the cotton in one of their hands, the spleen tissue, and the surrounding tissue.
filename = fullfile(filepath,"porcineSpleenHypercube.mat");
load(filename,"hcube")
rgbImg = colorize(hcube,Method="rgb",ContrastStretching=true);
figure
imshow(rgbImg)
Segment Hyperspectral Image
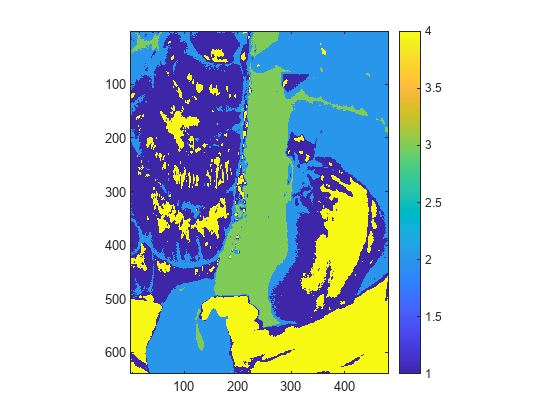
Segment the hyperspectral image into 4 classes using the hyperseganchor function. Observe that the spleen tissue has the label 3.
L = hyperseganchor(hcube,4);
figure
imagesc(L)
axis equal tight
colorbar
Identify Characteristics of Spleen
Compute the spleen mask from the segmentation labels.
spleenMask = L==3;
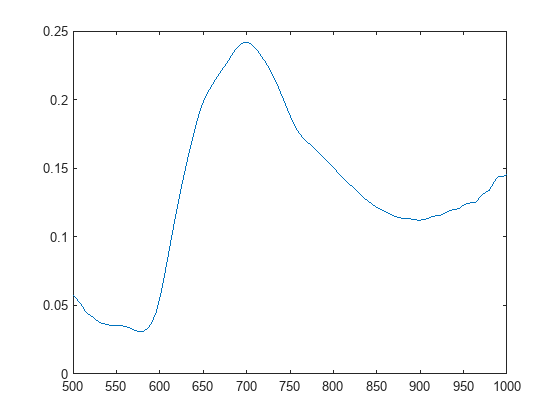
Plot the average spectrum of the detected spleen. It has a characteristic local maximum and local minimum.
datacube = gather(hcube);
[H,W,C] = size(datacube);
spectra = reshape(datacube,[],C)';
idx = reshape(spleenMask,1,[]);
spleenSpectra = mean(spectra(:,idx),2);
figure
plot(hcube.Wavelength,spleenSpectra)
Compute the ratio of the local maximum and local minimum as a custom spectral index. Use the custom spectral index to refine the segmentation of the spleen from the index image.
minIdx = islocalmin(spleenSpectra,MaxNumExtrema=1);
w1 = hcube.Wavelength(minIdx)
w1 =
898.9899
maxIdx = islocalmax(spleenSpectra,MaxNumExtrema=1);
w2 = hcube.Wavelength(maxIdx)
w2 =
696.9697
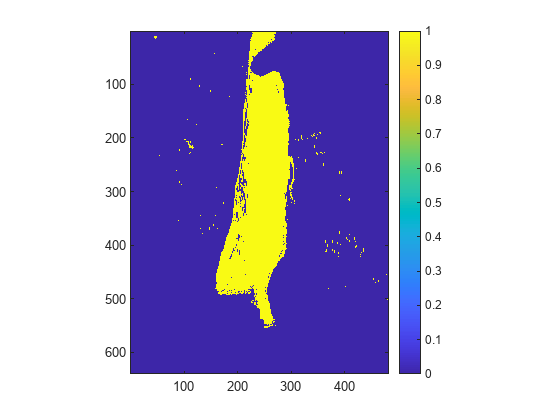
func = @(w1,w2) w2./w1;
spleenIndex = customSpectralIndex(hcube,[w1 w2],func);
thresh = multithresh(spleenIndex);
spleenMaskFinal = spleenIndex > thresh;
figure
imagesc(spleenMaskFinal)
axis equal tight
colorbar
Evaluate Spleen Identification
Load the ground truth spleen mask into the workspace.
filename = fullfile(filepath,"porcineSpleenMask.mat");
load(filename,"groundTruthMask")
Compute the Dice similarity score of the ground truth spleen mask and the spleen mask obtained from the initial segmentation.
dice(groundTruthMask,spleenMask)
ans =
0.7404
Compute the Dice similarity score of the ground truth spleen mask and the refined spleen mask obtained using the custom spectral index. Observe that the Dice score of the spleen mask improves after refining the segmentation with the custom spectral index.
dice(groundTruthMask,spleenMaskFinal)
ans =
0.7585
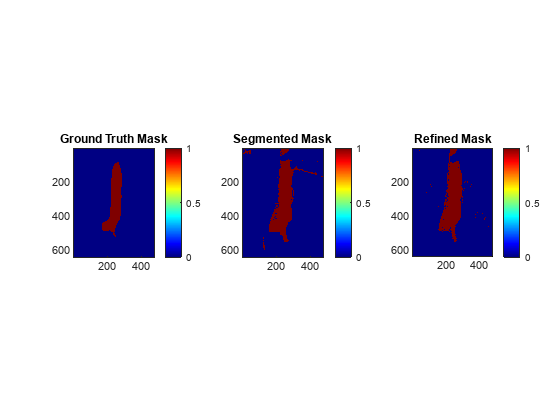
Visualize the ground truth spleen mask, the spleen mask obtained from the segmentation, and the refined spleen mask obtained after using the custom spectral index. Observe that the segmentation improves after refinement.
figure
tiledlayout(1,3)
nexttile
imagesc(groundTruthMask)
colorbar
colormap(jet)
axis equal tight
title("Ground Truth Mask")
nexttile
imagesc(spleenMask)
colorbar
colormap(jet)
axis equal tight
title("Segmented Mask")
nexttile
imagesc(spleenMaskFinal)
colorbar
colormap(jet)
axis equal tight
title("Refined Mask")
References
[1] Heidelberg Porcine HyperSPECTRAL (HeiPorSPECTRAL) Imaging Dataset, licensed under CC-BY-4.0.
[2] Studier-Fischer, Alexander, Silvia Seidlitz, Jan Sellner, Marc Bressan, Berkin Özdemir, Leonardo Ayala, Jan Odenthal, et al. “HeiPorSPECTRAL - the Heidelberg Porcine HyperSPECTRAL Imaging Dataset of 20 Physiological Organs.” Scientific Data 10, no. 1 (June 24, 2023): 414. https://doi.org/10.1038/s41597-023-02315-8.