Create Map of Quadrangle Using Cartographic Map Layout
This example shows how to display data in map axes using a cartographic map layout. A cartographic map layout displays only the data within the quadrangle specified by the CartographicLatitudeLimits and CartographicLongitudeLimits properties of the map axes object. Cartographic map layouts are useful for creating static maps and for preparing maps for publications.
The default map layout is appropriate for most data visualization and exploration workflows. To change the geographic limits of a map in the default layout, use the geolimits function instead of the CartographicLatitudeLimits and CartographicLongitudeLimits properties.
By default, most plotting functions reset many of the axes properties. As a result, this example customizes the properties of the axes after plotting the data. To customize map axes before plotting the data, set the hold state of the axes to on by using the hold function.
Use Default Cartographic Limits
Create a map in a cartographic map layout using the cartographic limits chosen by the map axes object.
Create Map Axes
Create a projected coordinate reference system (CRS) object that is appropriate for Antarctica. Use the WGS 84 / Antarctic Polar Stereographic projected CRS, which has the EPSG code 3031. Then, create a map axes object that uses the projected CRS.
figure
p1 = projcrs(3031);
mx1 = newmap(p1);
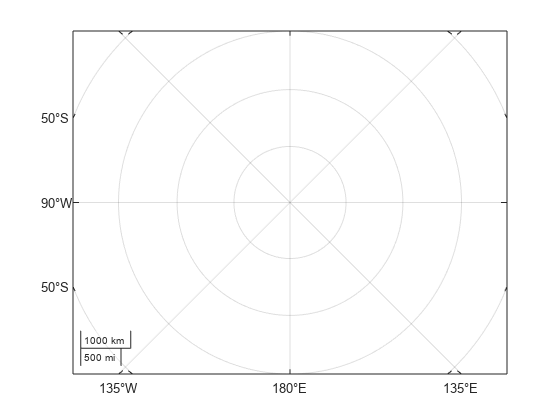
Query the cartographic latitude and longitude limits stored in the map axes object. When you create a map axes object, the object sets the CartographicLatitudeLimits and CartographicLongitudeLimits properties using the area of use for the projected CRS.
latlim1 = mx1.CartographicLatitudeLimits
latlim1 = 1×2

   -90   -60
lonlim1 = mx1.CartographicLongitudeLimits
lonlim1 = 1×2

  -180   180
By default, the map displays data in the box specified by the Position property of the axes object. For many projected CRSs, this box includes the quadrangle defined by the CartographicLatitudeLimits and CartographicLongitudeLimits properties and some areas surrounding the quadrangle. The axes object does not display data where the projection has undefined numeric results or extreme map distortion.
Read and Display Data
Read a shapefile that contains world land areas into the workspace as a geospatial table. The table represents the land areas using polygon shapes in geographic coordinates.
land = readgeotable("landareas.shp");Display the shapes on the map axes object. Then, change the map layout to cartographic. By default, the map axes object hides the scale bar when the map outline is curved.
geoplot(land)
mx1.MapLayout = "cartographic";
Add a title and subtitle.
title("Antarctica")
subtitle(p1.Name)
Export Map
Export the map to a PNG file. Specify the resolution of the image as 600 dots per inch.
exportgraphics(mx1,"antarctica.png",Resolution=600)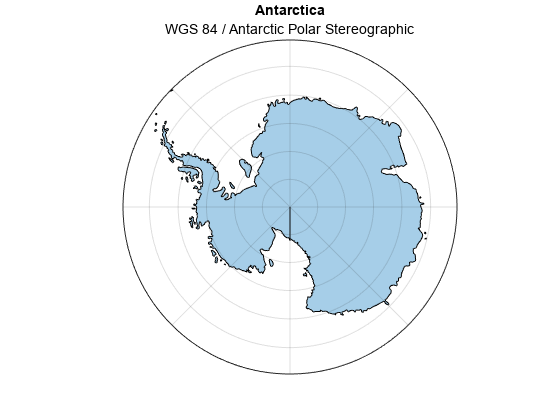
Change Cartographic Limits
Create a map in a cartographic map layout using cartographic limits that you specify. When you change the cartographic limits, the map axes object does not validate whether the limits are valid for the projected CRS. Use caution when changing the cartographic limit properties, for example, when specifying limits that are wider than the area of use for the projected CRS.
Create Map
Create a projected CRS object that is appropriate for Australia. Use the GDA94 / Geoscience Australia Lambert projected CRS, which has the EPSG code 3112. Then, create a map axes that uses the projected CRS.
figure
p2 = projcrs(3112);
mx2 = newmap(p2);
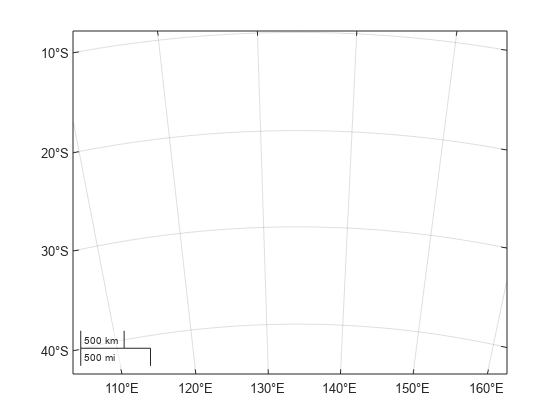
Query the cartographic latitude and longitude limits stored in the map axes object. When you create a map axes object, the object sets the CartographicLatitudeLimits and CartographicLongitudeLimits properties using the area of use for the projected CRS.
mx2.CartographicLatitudeLimits
ans = 1×2

  -43.7000   -9.8600
mx2.CartographicLongitudeLimits
ans = 1×2

  112.8500  153.6900
By default, the map displays data within the box specified by the Position property of the axes object. For many projected CRSs, this box includes the quadrangle defined by the CartographicLatitudeLimits and CartographicLongitudeLimits properties and some areas surrounding the quadrangle. The axes object does not display data where the projection has undefined numeric results or extreme map distortion.
Read and Display Data
Read a shapefile that contains world land areas into the workspace as a geospatial table. The table represents the land areas using polygon shapes in geographic coordinates.
land = readgeotable("landareas.shp");Display the shapes on the map axes object.
geoplot(land)
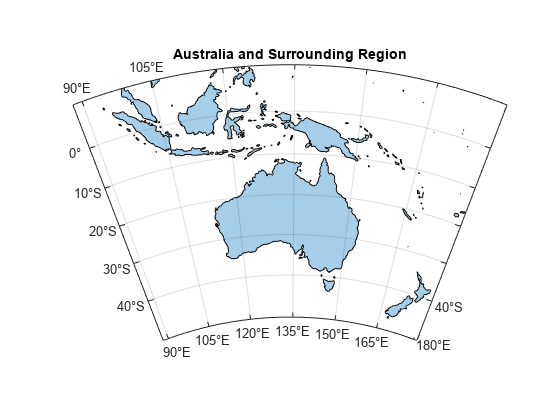
Specify latitude and longitude limits that are wider than the limits stored in the map axes object. Then, change the cartographic latitude and longitude limits to the wider limits.
latlim = [-50 10];
lonlim = [88 180];

mx2.CartographicLatitudeLimits = latlim;
mx2.CartographicLongitudeLimits = lonlim;
Change the map layout to cartographic. By default, the map axes object hides the scale bar when the map outline is curved.
mx2.MapLayout = "cartographic";Add a title and subtitle.
title("Australia and Surrounding Region")
Export Map
Export the map to a PNG file. Specify the resolution of the image as 600 dots per inch.
exportgraphics(mx2,"australia.png",Resolution=600)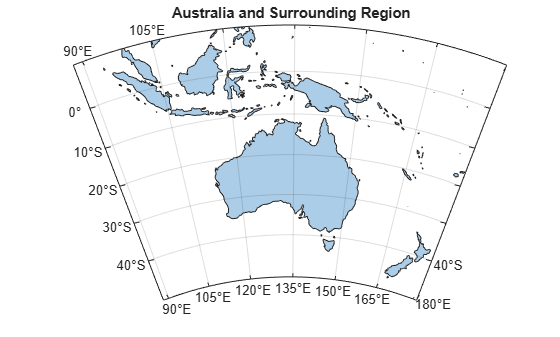
Tips
Some projected CRSs do not indicate the area of use. When a projected CRS does not indicate the area of use, the map axes object sets the CartographicLatitudeLimits property to [-90 90] and set the CartographicLongitudeLimits property to [-180 180].