主要内容

本页采用了机器翻译。点击此处可查看英文原文。

contourcmap

等高线颜色图与颜色栏

说明

contourcmap(cmap) 将当前图窗(及当前坐标区)的颜色图设置为预定义的颜色图。如果当前坐标区包含由 contourmcontourfmcontour3mgeoshow 函数创建的等高线对象,则颜色图中的颜色数量与等高线区间数量相匹配。否则,该颜色图包含 10 种颜色。

contourcmap(cmap,cdelta) 使用由 cdelta 指定的等高线级别更新当前图窗的颜色图。如果当前坐标区包含由 contourmcontourfmcontour3mgeoshow 函数创建的等高线对象,则 contourcmap 函数将忽略 cdelta 的值。

示例

contourcmap(___,Name,Value) 通过名称-值参数指定颜色栏的选项,同时支持与前文语法中任意输入参数的组合使用。例如,通过指定 "Colorbar","on" 来显示颜色栏。

示例

h = contourcmap(___) 返回颜色栏。

示例

全部折叠

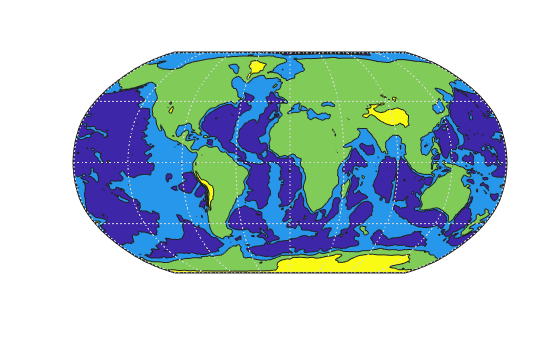
创建世界高程的填充等高线图。指定三个等高线层级(从而生成四个等高线区间)。

load topo60c
worldmap world
contourfm(topo60c,topo60cR,3)
plabel off
mlabel off

Figure contains an axes object. The hidden axes object contains 10 objects of type patch, line.

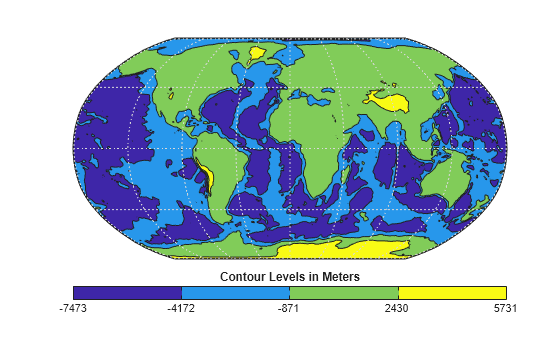
更改颜色图并添加带标签的颜色栏。请注意,该颜色图使用了相同数量的等高线间隔。

contourcmap("summer","Colorbar","on", ...
   "Location","horizontal","TitleString","Contour Levels in Meters")

Figure contains 2 axes objects. Axes object 1 with title Contour Levels in Meters contains an object of type image. Hidden axes object 2 contains 10 objects of type patch, line.

创建包含高程数据和海岸线数据的世界地图。使用曲面显示高程数据。

load topo60c
load coastlines
worldmap world
geoshow(topo60c,topo60cR,"DisplayType","surface")
geoshow(coastlat,coastlon,"Color","k")
mlabel off
plabel off

Figure contains an axes object. The hidden axes object contains 5 objects of type patch, surface, line.

更改颜色图,每隔 2000 米指定一个新的等高线级别,并添加带标签的颜色栏。

contourcmap("summer",2000,"Colorbar","on", ...
   "Location","horizontal", ...
   "TitleString","Contour Levels in Meters")

Figure contains 2 axes objects. Axes object 1 with title Contour Levels in Meters contains an object of type image. Hidden axes object 2 contains 5 objects of type patch, surface, line.

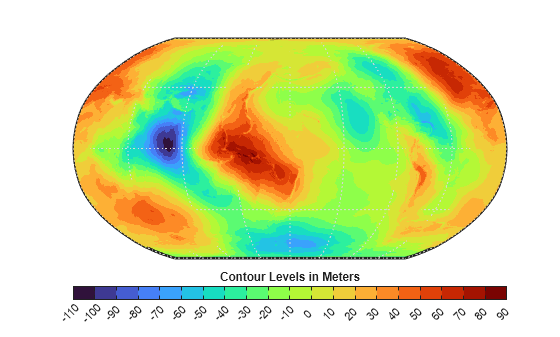
读取并显示基于 EGM96 大地水准面模型的空间参考大地水准面高程。更改颜色图,每隔 10 米指定一个新的等高线级别,并添加带标签的颜色栏。

[N,R] = egm96geoid;
worldmap(N,R)
geoshow(N,R,"DisplayType","surface")
plabel off
mlabel off

contourcmap("turbo",10,"Colorbar","on","Location","horizontal", ...
    "TitleString","Contour Levels in Meters")

Figure contains 2 axes objects. Axes object 1 with title Contour Levels in Meters contains an object of type image. Hidden axes object 2 contains 4 objects of type patch, surface, line.

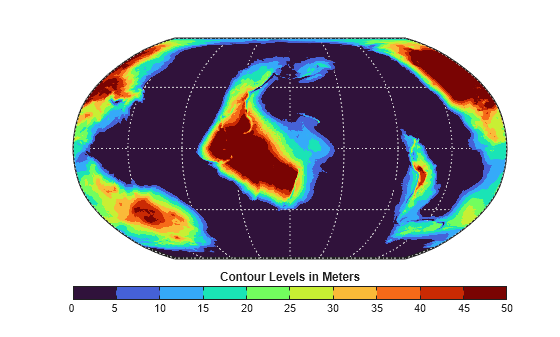
再次更改颜色图。要限制颜色范围,请使用均匀间隔值的向量指定等高线级别。该地图使用与最近等高线等值面相关的颜色,显示超出范围的大地水准面高度。

range = 0:5:50; 
contourcmap("turbo",range,"Colorbar","on","Location","horizontal", ...
    "TitleString","Contour Levels in Meters")

Figure contains 2 axes objects. Axes object 1 with title Contour Levels in Meters contains an object of type image. Hidden axes object 2 contains 4 objects of type patch, surface, line.

输入参数

全部折叠

颜色图,指定为下表中的选项之一。此参数接受任何由 colormap 函数支持的预定义颜色图。

颜色图名称色阶
"parula"

Color bar showing the colors of the parula colormap. The colormap starts at dark blue and transitions to lighter blue, green, orange and yellow. The transitions between colors are more perceptually uniform than in most other colormaps.

"turbo"

Color bar showing the colors of the turbo colormap. The colormap starts at dark blue and transitions to lighter blue, bright green, orange, yellow, and dark red. This colormap is similar to jet, but the transitions between colors are more perceptually uniform than in jet.

"hsv"

Color bar showing the colors of the hsv colormap. The colormap starts at red and transitions to yellow, bright green, cyan, dark blue, magenta, and bright orange.

"hot"

Color bar showing the colors of the hot colormap. The colormap starts at dark red and transitions to bright red, orange, yellow, and white.

"cool"

Color bar showing the colors of the cool colormap. The colormap starts at cyan and transitions to light blue, light purple, and magenta.

"spring"

Color bar showing the colors of the spring colormap. The colormap starts at magenta and transitions to pink, light orange, and yellow.

"summer"

Color bar showing the colors of the summer colormap. The colormap starts at medium green and transitions to yellow.

"autumn"

Color bar showing the colors of the autumn colormap. The colormap starts at bright orange and transitions to yellow.

"winter"

Color bar showing the colors of the winter colormap. The colormap starts at dark blue and transitions to bright green.

"gray"

Color bar showing the gray colormap. The colormap starts at black and transitions to white.

"bone"

Color bar showing the bone colormap. This colormap has colors that are approximately gray with a slight blue color tint. The colormap starts at dark gray and transitions to white.

"copper"

Color bar showing the copper colormap. This colormap starts at black and transitions to a medium orange, similar to the color of copper.

"pink"

Color bar showing the pink colormap. This colormap starts at dark red and transitions to dark pink, tan, and white.

"jet"

Color bar showing the colors of the jet colormap. The colormap starts at dark blue and transitions to light blue, bright green, orange, yellow, and dark red.

"lines"

Color bar showing the colors of the lines colormap. The colormap contains a repeating pattern of colors: dark blue, dark orange, dark yellow, dark purple, medium green, light blue, and dark red.

"colorcube"

Color bar showing the colors of the colorcube colormap. The colormap is a course sampling of the RGB colorspace.

"prism"

Color bar showing the colors of the prism colormap. The colormap contains a repeating pattern of colors: red, orange, yellow, green, blue, and purple.

"flag"

Color bar showing the colors of the flag colormap. The colormap contains a repeating pattern of colors: red, white, blue, and black.

"white"

Color bar showing the white colormap, which is entirely white.

数据类型: char | string

等高线,指定为数值标量或均匀间隔数值的数值向量。

  • cdelta 为标量,则该函数将以 cdelta 的倍数生成新的等高线。

  • cdelta 是均匀间隔值的向量,则该函数将在这些值处生成新的等高线。

名称-值参数

全部折叠

将可选参量对组指定为 Name1=Value1,...,NameN=ValueN,其中 Name 是参量名称,Value 是对应的值。名称-值参量必须出现在其他参量之后,但对各个参量对组的顺序没有要求。

示例: contourcmap("turbo",Colorbar="on") 将图窗颜色图更改为 "turbo" 并显示颜色栏

如果使用的是 R2021a 之前的版本,请使用逗号分隔每个名称和值,并用引号将 Name 引起来。

示例: contourcmap("turbo","Colorbar","on") 将图窗颜色图更改为 "turbo" 并显示颜色栏

注意

除了本节中的名称-值参数外,您还可以使用名称-值参数为本函数返回的 Axes 对象的属性指定值。有关 Axes 对象属性的更多信息,请参阅 Axes 属性

颜色栏可见性,指定为以下选项之一:

  • "on" - 显示颜色栏。

  • "off" - 不显示颜色栏。

数据类型: char | string

颜色栏相对于坐标区的位置,可选以下选项之一:

  • "vertical" - 将颜色栏垂直显示于坐标区右侧。

  • "horizontal" - 将颜色栏水平显示于坐标区下方。

  • "none" - 不显示颜色栏。

数据类型: char | string

颜色栏中标签的对齐方式,可选以下选项之一:

  • "center" - 将标签居中对齐在色带上。

  • "ends" - 将标签居中对齐于颜色分隔处。

若图窗包含由 contourmcontourfmcontour3mgeoshow 函数创建的等高线对象,则 contourcmap 函数将此参数值设置为:等高线对应 "center",填充等高线对应 "ends",且不受您指定选项的影响。

数据类型: char | string

图形对象,用于确定颜色图的范围,指定为图形对象。

颜色栏标题,指定为字符向量或字符串标量。

数据类型: char | string

颜色栏 x 轴标签,指定为字符向量或字符串标量。

数据类型: char | string

颜色栏 y 轴标签,指定为字符向量或字符串标量。

数据类型: char | string

输出参量

全部折叠

输出颜色栏,以 Axes 对象形式返回。

版本历史记录

在 R2006a 之前推出