GlobeViewer
R2026bDescription
Add-On Required: This feature requires the 3D Scenarios add-on.
Visualize a 3D scenario using a GlobeViewer object.
Creation
Create a GlobeViewer object by using the viewer
function.
Properties
Viewer
Name of the viewer, specified as a string scalar or character vector. The viewer displays the name in the title bar.
Data Types: string | char
Basemap, specified as one of the values listed in the table. Six of the basemaps in the table are tiled data sets created using Natural Earth. Five of the basemaps are high-zoom-level maps hosted by Esri®.
|
|
Full global basemap composed of high-resolution satellite imagery. Hosted by Esri. |
|
General-purpose road map that emphasizes accurate, legible styling of roads and transit networks. Hosted by Esri. |
|
|
Map designed to provide geographic context while highlighting user data on a light background. Hosted by Esri. |
|
Map designed to provide geographic context while highlighting user data on a dark background. Hosted by Esri. |
|
|
General-purpose map with styling to depict topographic features. Hosted by Esri. |
|
Map that combines satellite-derived land cover data, shaded relief, and ocean-bottom relief. The light, natural palette is suitable for thematic and reference maps. Created using Natural Earth. |
|
|
Shaded relief map blended with a land cover palette. Humid lowlands are green and arid lowlands are brown. Created using Natural Earth. |
|
Terrain map in shades of gray. Shaded relief emphasizes both high mountains and micro-terrain found in lowlands. Created using Natural Earth. |
|
|
Two-tone, land-ocean map with light green land areas and light blue water areas. Created using Natural Earth. |
|
Two-tone, land-ocean map with gray land areas and white water areas. Created using Natural Earth. |
|
|
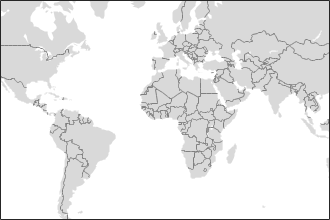
Two-tone, land-ocean map with light gray land areas and dark gray water areas. This basemap is installed with MATLAB®. Created using Natural Earth. |
Not applicable. |
Custom basemap added using the |
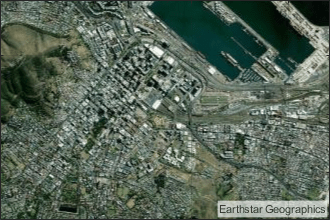

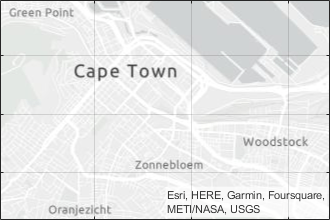
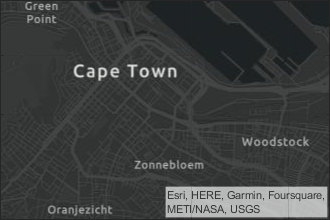
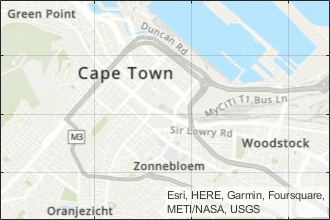
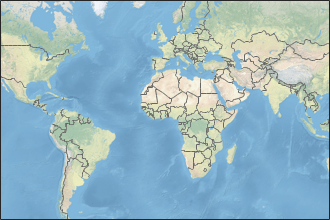
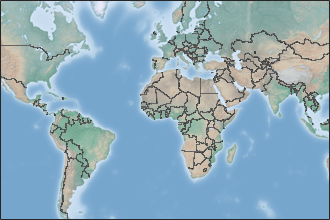
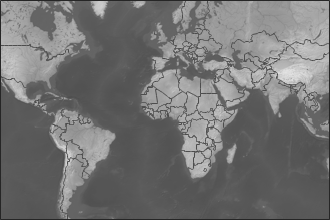
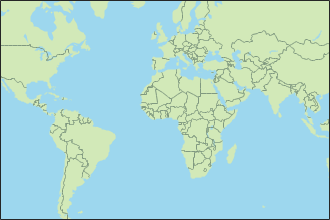

All basemaps except "darkwater" require internet access. The "darkwater" basemap is included with MATLAB.
If you do not have consistent access to the Internet, you can download the basemaps created using Natural Earth onto your local system by using the Add-On Explorer. The basemaps hosted by Esri are not available for download. For more about using basemaps in offline environments, see Use Basemaps in Offline Environments.
The basemaps hosted by Esri update periodically. As a result, you might see differences in your visualizations over time.
Alignment of boundaries and region labels are a presentation of the feature provided by the data vendors and do not imply endorsement by MathWorks®.
Option to automatically update visuals, specified as "on" or "off", or as a numeric or logical 1 (true) or 0 (false). A value of "on" is equivalent to true, and "off" is equivalent to false. Thus, you can use the value of this property as a logical value. The value is stored as an on/off logical value of type matlab.lang.OnOffSwitchState.
"on"— The viewer automatically visualizes all changes to the scenario."off"— You control when the viewer visualizes changes to the scenario. Update existing visuals by using theupdatefunction. Visualize new actor, behavior, and analysis objects by setting theVisibleproperty of the corresponding visual object totrue.
Camera motion mode, specified as one of these options:
"auto"— The camera automatically moves when new actor, behavior, and analysis objects are added to the scenario, so that the new object is centered in the view. The viewer maintains the current zoom level, or minimally zooms out to view the new object."manual"— The camera does not move when new objects are added to the scenario.
Position
Size and location of the viewer relative to the parent object, specified as a
4-element vector of the form [left bottom width height]. By default
MATLAB measures the values in units normalized to the parent container. To change
the units, set the Units property. By default, the viewer spans the
whole interior of the parent container.
The
leftandbottomelements define the distance from the lower-left corner of the parent container to the lower-left corner of the viewer.The
widthandheightelements are the width and height of the viewer.
Position units, specified as one of the values in the table. This value specifies
units for the Position property.
Units | Description |
|---|---|
"normalized" (default) | Units normalized with respect to the container, which is typically the
figure or a panel. The lower left corner of the container is
(0,0) and the upper right corner is
(1,1). |
"inches" | Inches. |
"centimeters" | Centimeters. |
"characters" | Units based on the default
|
"points" | Typography points. One point equals 1/72 inch. |
"pixels" | Pixels. On Windows® and Macintosh systems, the size of a pixel is 1/96th of an inch. This size is independent of your system resolution. On Linux® systems, the size of a pixel is determined by your system resolution. |
Parent/Child
Visual children, represented as an array of visual objects.
When you add an entity such as an actor, trajectory, or analysis to the scenario,
MATLAB creates a visual object and stores the visual object in this property.
Examples of visual objects are ActorVisual,
WaypointTrajectoryVisual, LOSVisual, and
RayTraceVisual.
To find and return the visual object that corresponds to an entity, use the
getvisual
function.
Adding or removing children using this property is not supported.
Object Functions
Version History
Introduced in R2026b

