addCustomBasemap
Add custom basemap
Syntax
Description
Add Basemap from Web Source
addCustomBasemap(
adds a custom basemap to the list of basemaps available for use with mapping functions.
This syntax adds the basemap from a parameterized URL. basemapName,URL)basemapName is
the name you choose to call the custom basemap.
You can use custom basemaps with several types of map displays, for example,
geographic axes created using the geoaxes
function and geographic globes created using the geoglobe
function.
Added basemaps remain available for use in future MATLAB® sessions.
addCustomBasemap(
adds a custom basemap from a Web Map Service (WMS) layer. (since R2024b)basemapName,wmsLayer)
addCustomBasemap(
adds a custom basemap from a URL containing a WMS GetMap request. (since R2024b)basemapName,wmsGetMapRequestURL)
Add Basemap from File, Image, or Data Grid
addCustomBasemap(
adds a custom basemap from an MBTiles file containing raster or vector map tiles. You can
use the basemap in future MATLAB sessions, provided the MBTiles file is still on the same path as when you
add it. (since R2022a)basemapName,mbtilesFilename)
addCustomBasemap(
adds a custom basemap from a georeferenced image or data grid. Specify the image or data
grid using an array and a raster reference object. The input image or data grid must be
referenced to Earth. (since R2024b)basemapName,A,R)
Additional Options
addCustomBasemap(___,
specifies name-value arguments that set additional parameters of the basemap.Name=Value)
Examples
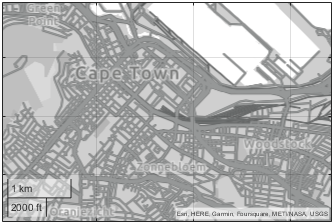
Display point locations on a geographic bubble chart using a basemap from OpenStreetMap®.
Specify values for these arguments:
A name that identifies the custom basemap.
The URL of the map tiles. For load balancing, this provider has three servers you can use (
a,b, andc).An attribution that gives credit to the provider of the map tiles. When you plot data, this attribution appears at the bottom of the map. Map tile providers can define specific requirements for the attribution.
basemapName = "openstreetmap";
url = "a.tile.openstreetmap.org/${z}/${x}/${y}.png";
copyright = char(uint8(169));
attribution = copyright + "OpenStreetMap contributors";
Add the custom basemap to the list of basemaps available for use with mapping functions.
addCustomBasemap(basemapName,url,Attribution=attribution)
Specify the latitude and longitude coordinates of several point locations. Then, plot the coordinates using a geographic bubble chart.
lat = [42.3501 42.3515 42.3598 42.3584 42.3529];
lon = [-71.0870 -71.0926 -71.0662 -71.0598 -71.0662];

gb = geobubble(lat,lon,Basemap=basemapName);
gb.BubbleWidthRange = 25;
gb.MapLayout = "maximized";
gb.ZoomLevel = 14;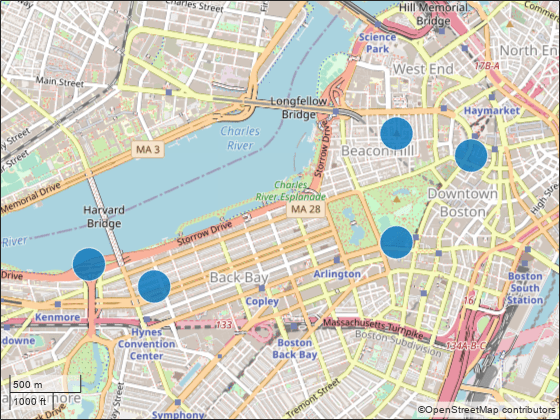
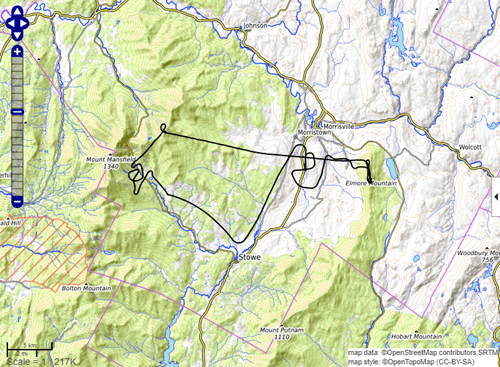
Display the route of a glider on a map using a basemap from OpenTopoMap.
Specify values for these arguments:
A name that identifies the custom basemap.
The URL of the map tiles. For load balancing, this provider has three servers you can use (
a,b, andc).An attribution that gives credit to the provider of the map tiles. When you plot data, this attribution appears at the bottom of the map. Map tile providers can define specific requirements for the attribution.
basemapName = "opentopomap";
url = "a.tile.opentopomap.org/${z}/${x}/${y}.png";
copyright = char(uint8(169));
attribution = [ ...
      "map data:  " + copyright + "OpenStreetMap contributors,SRTM", ...
      "map style: " + copyright + "OpenTopoMap (CC-BY-SA)"];
Add the custom basemap to the list of basemaps available for use with mapping functions.
addCustomBasemap(basemapName,url,"Attribution",attribution)Create a map that uses the OpenTopoMap basemap. Then, read glider data into the workspace and plot it over the basemap.
figure
geobasemap(basemapName)
trk = readgeotable("sample_mixed.gpx",Layer="tracks");
geoplot(trk,"r","LineWidth",2)
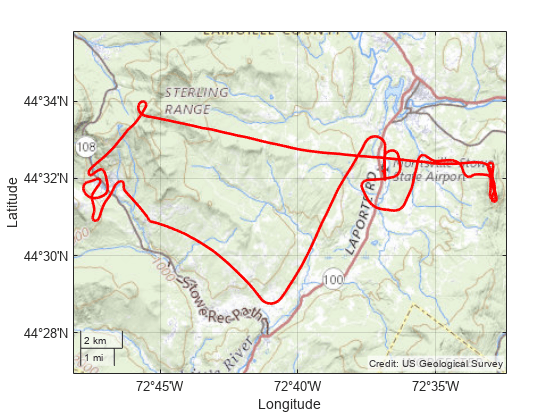
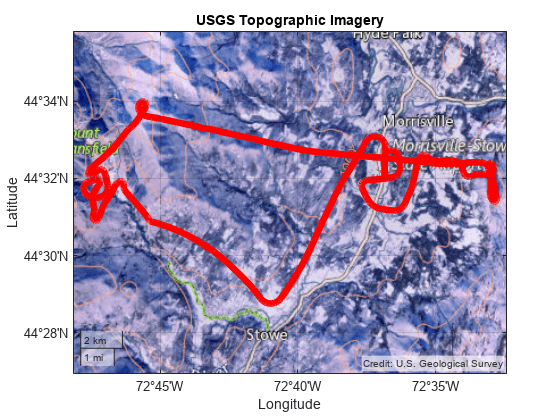
Display the route of a glider in 2-D and 3-D using a topographic basemap from the USGS National Map.
Specify values for these arguments:
A name that identifies the custom basemap.
The URL for the map tiles. This URL includes the URL of the National Map ArcGIS REST Services Directory and the path to the map tiles from the USGS Topo basemap service.
An attribution that gives credit to the provider of the map tiles. When you plot data, this attribution appears at the bottom of the map. Map tile providers can define specific requirements for the attribution.
basemapName = "usgstopo";
url = "https://basemap.nationalmap.gov/ArcGIS/rest/services/" + ...
    "USGSTopo/MapServer/tile/${z}/${y}/${x}/png";
att = "Credit: US Geological Survey";
Add the basemap to the list of basemaps available for use with mapping functions.
addCustomBasemap(basemapName,url,"Attribution",att)Import a GPX file that contains the path of a glider. Extract the latitude coordinates, longitude coordinates, and elevations.
trk = readgeotable("sample_mixed.gpx","Layer","track_points");
lat = trk.Shape.Latitude;
lon = trk.Shape.Longitude;
h = trk.Elevation;
Display the path in 2-D using the USGS Topo basemap.
geoplot(lat,lon,"r","LineWidth",2)
geobasemap(basemapName)
Display the path in 3-D using a geographic globe and the same basemap. By default, the view is directly above the path. Tilt the view by holding Ctrl and dragging.
uif = uifigure;
g = geoglobe(uif,"Basemap","usgstopo");
geoplot3(g,lat,lon,h,"r","LineWidth",2)

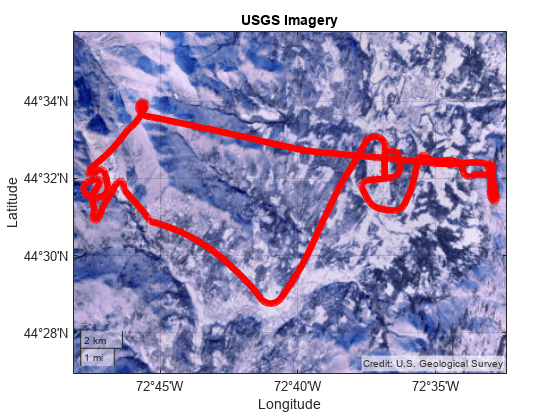
Plot the path of a glider over a variety of basemaps that are available from the USGS National Map site. Viewing data over several maps can help you determine which map provides the best background.
This example adds each basemap using a loop. Prepare to add the basemaps by specifying these arguments:
The URL of the map tiles. The USGS National Map supports several tiled maps. For this example, insert the word
BASEMAPinto the URL string. The loop replaces the wordBASEMAPwith the names of the maps supported by the USGS National Map.The names of USGS basemaps. The loop inserts these names into the URL in place of
BASEMAP.The display names to use for each basemap.
An attribution that gives credit to the provider of the map tiles. When you plot data, this attribution appears at the bottom of the map. Map tile providers can define specific requirements for the attribution.
The maximum zoom level for the basemaps.
baseURL = "https://basemap.nationalmap.gov/ArcGIS/rest/services";
usgsURL = baseURL + "/BASEMAP/MapServer/tile/${z}/${y}/${x}/png";
basemapNames = ["USGSImageryOnly" "USGSTopo" "USGSHydroCached"];
displayNames = ["USGS Imagery" "USGS Shaded Topographic Map" "USGS Hydrography"];
attribution = "Credit: U.S. Geological Survey";
maxZoomLevel = 16;
Import a GPX file that contains the path of a glider.
GT = readgeotable("sample_mixed.gpx",Layer="tracks");
Use a loop to add each basemap and display the glider path over each basemap.
for k =1:length(basemapNames)
   basemap = basemapNames(k);
   name = lower(basemap);
   url = replace(usgsURL,"BASEMAP",basemap);
   displayName = displayNames(k);

   addCustomBasemap(name,url,Attribution=attribution, ...
         DisplayName=displayName,MaxZoomLevel=maxZoomLevel)

   figure
   geobasemap(basemap)
   geoplot(GT,"r",LineWidth=5);
   title(displayName)
end

Display data on a vector basemap hosted by Esri®.
Add the basemap to the list of basemaps available for use with mapping functions. For this example, add the basemap using the map tiles URL and style URL for National Geographic Style [1].
basemapName1 = "natgeostyle";
url = "https://basemaps.arcgis.com/arcgis/rest/services/" + ...
    "World_Basemap_v2/VectorTileServer/tile/${z}/${x}/${y}.pbf";
style = "https://www.arcgis.com/sharing/rest/content/items/" + ...
    "3d1a30626bbc46c582f148b9252676ce/resources/styles/root.json?f=pjson";
addCustomBasemap(basemapName1,url,Style=style)
Import a GPX file that contains the path of a glider. Extract the latitude coordinates, longitude coordinates, and elevations.
trk = readgeotable("sample_mixed.gpx","Layer","track_points");
lat = trk.Shape.Latitude;
lon = trk.Shape.Longitude;
h = trk.Elevation;
Display the path in 2-D using the National Geographic Style basemap.
geoplot(lat,lon,"m",LineWidth=2)
geobasemap(basemapName1)
You can also customize the appearance of the basemap by using a predefined style. For example, add another basemap using the same map tiles URL and a predefined topographic style.
basemapName2 = "topostyle";
addCustomBasemap(basemapName2,url,Style="topographic")
Display the path in 3-D using the new basemap.
uif = uifigure;
g = geoglobe(uif,Basemap=basemapName2);
geoplot3(g,lat,lon,h,"m",LineWidth=2)
[1] "National Geographic Style - Overview." ArcGIS Online. Accessed December 8, 2022. https://www.arcgis.com/home/item.html?id=3d1a30626bbc46c582f148b9252676ce.
Creating custom basemaps from MBTiles files is useful when you do not have internet access.
MBTiles files can contain raster or vector map tiles. Raster map tiles are useful for displaying satellite imagery and orthoimagery. Vector map tiles enable you to customize the appearance of the basemap and typically include higher zoom levels than raster map tiles. If you do not know whether your MBTiles file contains raster or vector map tiles, check with your data provider.
Raster MBTiles File
Create a basemap from an MBTiles file containing raster map tiles. Mapping Toolbox includes a raster MBTiles file, usgsimagery.mbtiles, with low-resolution USGS imagery.
Add the USGS Imagery basemap to the list of basemaps available for use with mapping functions. The addCustomBasemap function uses the attribution and maximum zoom level contained in the file.
basemap1 = "usgsimagery";
mbtilesFilename1 = "usgsimagery.mbtiles";
addCustomBasemap(basemap1,mbtilesFilename1)
Read worldwide land areas into the workspace as a geospatial table. Create a subtable containing only Australia.
GT = readgeotable("landareas.shp");
australia = GT(GT.Name == "Australia",:);
Display the outline of Australia over the USGS Imagery basemap.
figure
geoplot(australia,"LineWidth",2,"FaceColor","none")
geobasemap usgsimagery

Vector MBTiles File
(Since R2023a)
Create a basemap from an MBTiles file containing vector map tiles. Mapping Toolbox includes a vector MBTiles file, naturalearth.mbtiles, with low-zoom levels of region and land boundaries.
Add the Natural Earth basemap to the list of basemaps available for use with mapping functions. Specify the appearance of the basemap, including the colors and fonts, using a predefined style.
basemap2 = "naturalearth";
mbtilesFilename2 = "naturalearth.mbtiles";
style = "streets";
addCustomBasemap(basemap2,mbtilesFilename2,Style=style)
Create a map using the Natural Earth basemap. Zoom into a region including the northeast United States.
figure
geobasemap naturalearth
geolimits([39.7 47.7],[-82.22 -64.57])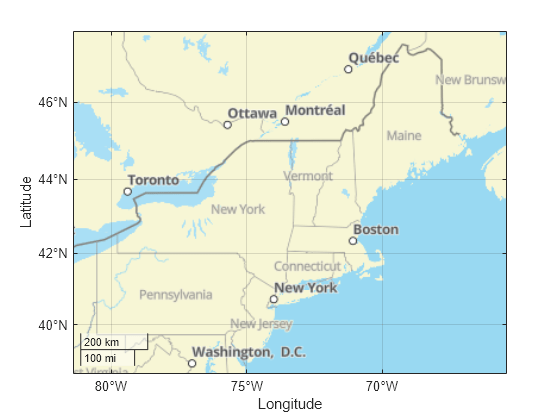
Since R2024b
Read a GeoTIFF file containing imagery of Boston into the workspace as an array and a map cells reference object. The array is a grid of cells referenced to projected coordinates.
[A,R] = readgeoraster("boston.tif");Add a custom basemap from the array and reference object. The addCustomBasemap function issues a warning because the array and reference object do not specify global data for zoom level 0.
addCustomBasemap("bostonBasemap",A,R)Warning: Basemap contains regional data with latitude limits in the range [42.3451, 42.3713] and longitude limits in the range [-71.0999, -71.0454]. Global map displays might show missing tiles.
Display the custom basemap using a geographic axes. MATLAB® sets the limits of the axes to closely match the limits of the basemap data. The black background indicates areas where the basemap tile contains no data.
figure
geobasemap bostonBasemap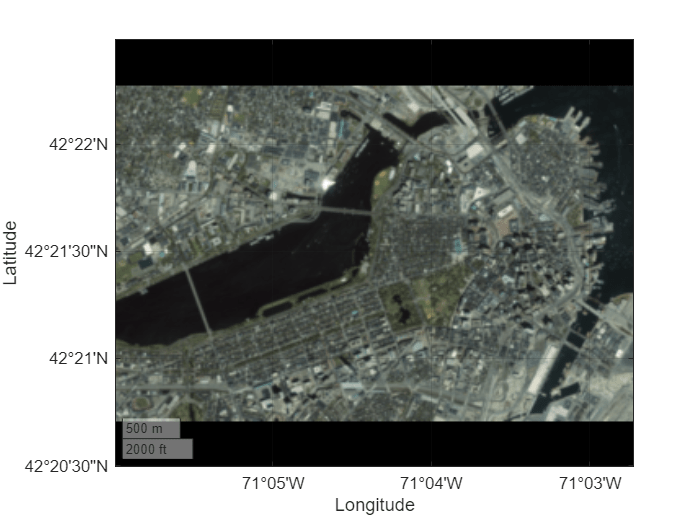
Since R2024b
To add a custom basemap with full-color tiles from quantitative data, you must first convert the data to an indexed image and a colormap, and then convert the indexed image and colormap to an RGB image.
Search the Web Map Service (WMS) Database for a layer containing terrain elevation data from the WMS server hosted by MathWorks®. The elevation data is derived from GMTED2010.
layers = wmsfind("mathworks",SearchField="serverurl");
elevation = refine(layers,"elevation");
Read global elevation data from the server. Specify the raster size as 2048-by-4096, and specify the format as BIL. The wmsread function represents the data using an array and a geographic cells reference object.
[Z,R] = wmsread(elevation,Latlim=[-90 90],Lonlim=[-180 180], ...
    ImageHeight=2048,ImageWidth=4096,ImageFormat="image/bil");
Convert the elevation data to an indexed image and a colormap. An indexed image is an array of integers, where each integer maps to a row of the colormap. Each row of the colormap is an RGB triplet that specifies the red, green, and blue components of a color.
Prepare to visualize the water areas in blue by setting elevations at or below sea level (
Z <= 0) to a value below sea level.Specify the number of colors to include in the colormap as 256.
Create a colormap that is appropriate for elevation data.
Rescale the elevation data to the interval [0, 255].
Create the indexed image by converting the rescaled elevation data to an array of 16-bit unsigned integers. Note that the largest value of the unsigned integer type must be greater than the number of colors in the colormap.
% create colormap
Z(Z <= 0) = -1;
numColors = 256;
cmap = demcmap(Z,numColors);

% create indexed image
X = rescale(Z,0,numColors-1);
X = uint16(X);
Convert the indexed image to an RGB image of 8-bit unsigned integers.
rgb = ind2rgb8(X,cmap);
Add a custom basemap from the RGB image and reference object. Specify an attribution for the basemap by using the Attribution name-value argument.
addCustomBasemap("gmted2010",rgb,R,Attribution="US Geological Survey")
Create a geographic globe that uses the custom basemap. Position the camera above South America.
uif = uifigure;
g = geoglobe(uif,Basemap="gmted2010");

campos(g,-18,-62)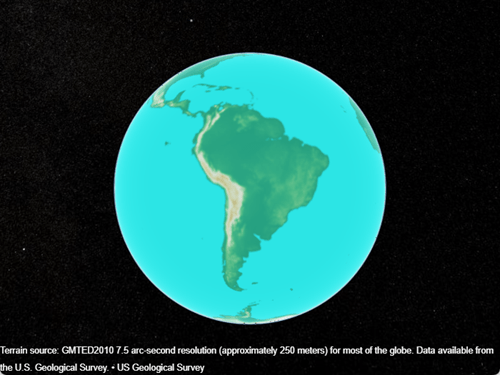
Since R2024b
A WMS server provides images of publicly accessible geospatial information from web-based sources. For introductory information about WMS servers, see Basic Workflow for Creating WMS Maps.
Search the WMS Database for layers from the GEBCO WMS server. Refine the list to include the "GEBCO_LATEST_2_sub_ice_topo" layer, which contains color-shaded elevation and under-ice topography for the globe. Synchronize the layer with the WMS server.
layers = wmsfind("gebco.net",SearchField="serverurl");
iceTopoLayer = refine(layers,"GEBCO_LATEST_2_sub_ice_topo");
iceTopoLayer = wmsupdate(iceTopoLayer);
Add a custom basemap using the WMS layer. Specify an attribution by using the Attribution name-value argument and the title of the layer.
attribution = iceTopoLayer.LayerTitle;
addCustomBasemap("gebcoIceTopo",iceTopoLayer,Attribution=attribution)
Create a geographic globe that uses the custom basemap. Position the camera above Europe.
uif = uifigure;
g = geoglobe(uif,Basemap="gebcoIceTopo");

campos(g,33,8,4e6)
campitch(g,-70)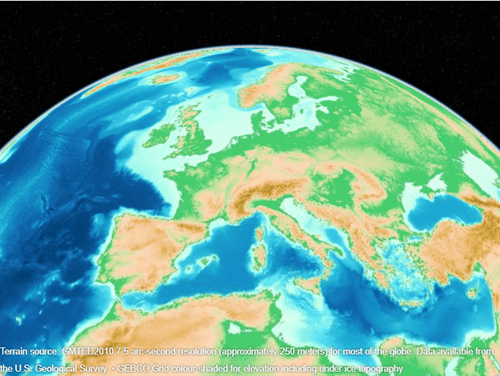
Since R2024b
A WMS server provides images of publicly accessible geospatial information from web-based sources. A WMS GetMap request enables you to read an image with the specified geographic limits at a specified time. For more information about WMS GetMap requests, see Modify Your WMS Map Request.
Get information about a WMS server from NOAA's Environmental Research Division Data Access Program (ERDDAP). Extract the list of layers.
info = wmsinfo("https://coastwatch.pfeg.noaa.gov/erddap/wms/NOAA_DHW/request?");
layers = info.Layer;
Refine the list to include sea surface temperatures and a land mask.
sst = refine(layers,"dhw_5km:CRW_SST",MatchType="exact");
mask = refine(layers,"LandMask",MatchType="exact");
sstMasked = [sst mask];
Create a WMS map request from the layers. Request data from January 1, 2000 by updating the Time property of the map request.
mapRequest = WMSMapRequest(sstMasked);
mapRequest.Time = "2000-01-01";
Get the WMS GetMap request URL from the map request. Then, add a custom basemap using the URL. Specify an attribution by using the Attribution name-value argument and the title of the server.
urlJan2000 = mapRequest.RequestURL;
attribution = info.ServerTitle;
addCustomBasemap("sstJan2000",urlJan2000,Attribution=attribution)
Display the basemap in a geographic axes object by using the geobasemap function. Add a title using the time stored in the map request.
figure
geobasemap sstJan2000
title(mapRequest.Time)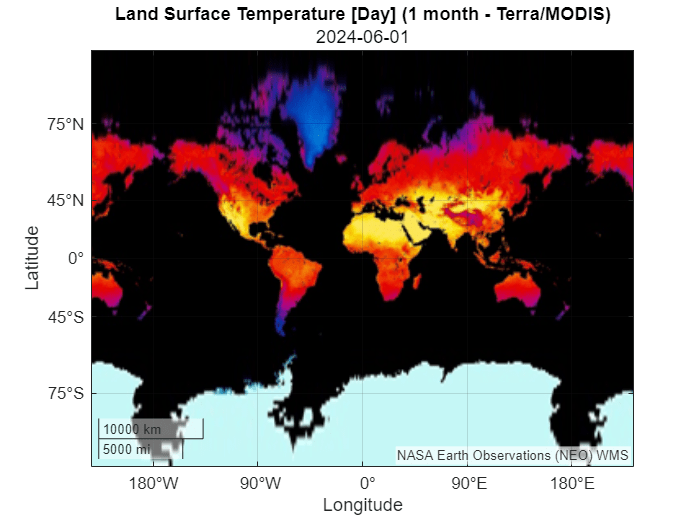
Add a second basemap using temperatures from August 1, 2020. Update the Time property of the map request, get the updated WMS GetMap request URL, and add the basemap using the updated URL.
mapRequest.Time = "2020-08-01";
urlAug2020 = mapRequest.RequestURL;
addCustomBasemap("sstAug2020",urlAug2020,Attribution=attribution)
Display the second basemap in a new geographic axes object.
figure
geobasemap sstAug2020
title(mapRequest.Time)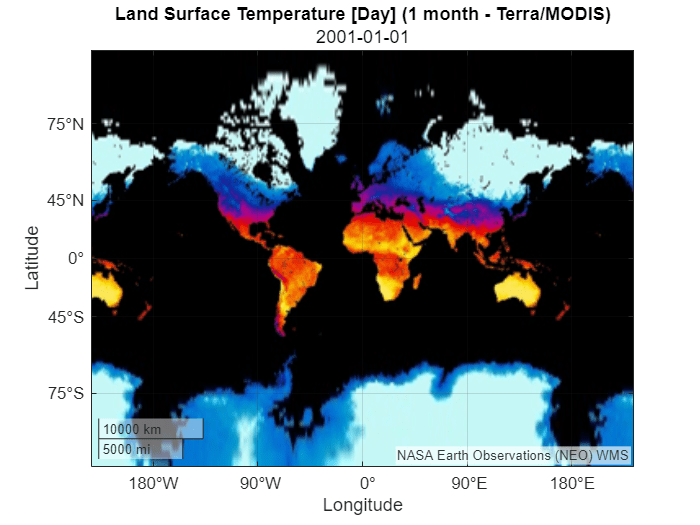
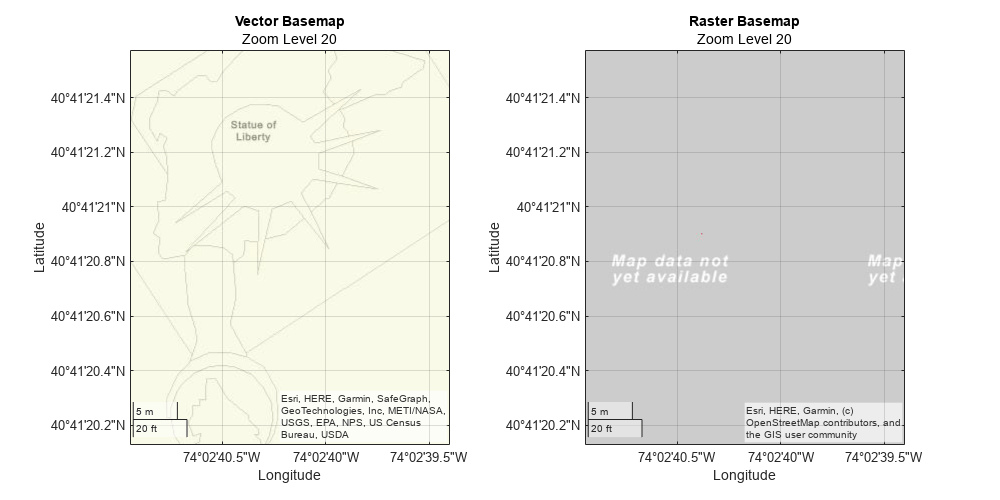
Starting in R2023a, you can add custom basemaps using vector map tiles hosted by Esri. Vector map tiles enable you to customize the appearance of the basemap and typically include higher zoom levels than raster map tiles. This example creates vector and raster versions of similar Esri basemaps and compares the map tiles at different zoom levels.
Specify the maximum zoom level to use for the custom basemaps.
maxzoom = 20;
Add a custom basemap using the map tiles URL for Streets [1]. This basemap uses vector map tiles.
basemapName1 = "streetsvector";
url1 = "https://basemaps.arcgis.com/arcgis/rest/services/" + ...
    "World_Basemap_v2/VectorTileServer/tile/${z}/${x}/${y}.pbf";
addCustomBasemap(basemapName1,url1,Style="streets",MaxZoomLevel=maxzoom)
Add the custom basemap using the map tiles URL for World Street Map [2]. This basemap uses raster map tiles.
basemapName2 = "streetsraster";
url2 = "https://services.arcgisonline.com/arcgis/rest/services/" + ...
    "World_Street_Map/MapServer/tile/${z}/${y}/${x}.png";
attribution = "Esri, HERE, Garmin, (c) OpenStreetMap contributors, " + ...
    "and the GIS user community";
addCustomBasemap(basemapName2,url2,Attribution=attribution,MaxZoomLevel=maxzoom)
Create two maps in a tiled chart layout. Place the vector basemap in the left tile and the raster basemap in the right tile. Center both maps on the Statue of Liberty in New York City.
f = figure(Position=[500 500 1000 500]);
center = [40.689125327367890 -74.044492429136966];
initialzoom = 14;

t = tiledlayout(1,2);
gx1 = geoaxes(t,Basemap=basemapName1,MapCenter=center,ZoomLevel=initialzoom);
title("Vector Basemap")
subtitle("Zoom Level " + initialzoom)

gx2 = geoaxes(t,Basemap=basemapName2,MapCenter=center,ZoomLevel=initialzoom);
gx2.Layout.Tile = 2;
title("Raster Basemap")
subtitle("Zoom Level " + initialzoom)

Use a loop to view the basemap at increasing zoom levels. Unlike the vector basemap at this location, the raster basemap does not contain data at zoom level 20.
for zoom = initialzoom:0.5:maxzoom
    gx1.ZoomLevel = zoom;
    gx2.ZoomLevel = zoom;

    subtitle(gx1,"Zoom Level " + zoom)
    subtitle(gx2,"Zoom Level " + zoom)

    drawnow
    pause(0.75)
end
[1] "Streets - Overview." ArcGIS Online. Accessed December 7, 2022. https://www.arcgis.com/home/item.html?id=de26a3cf4cc9451298ea173c4b324736.
[2] "World Street Map - Overview." ArcGIS Online. Accessed December 7, 2022. https://www.arcgis.com/home/item.html?id=3b93337983e9436f8db950e38a8629af.
Input Arguments
Name-Value Arguments
Specify optional pairs of arguments as
Name1=Value1,...,NameN=ValueN, where Name is
the argument name and Value is the corresponding value.
Name-value arguments must appear after other arguments, but the order of the
pairs does not matter.
Example: addCustomBasemap(basemapName,URL,Attribution="My
attribution") specifies the attribution for the custom basemap.
Before R2021a, use commas to separate each name and value, and enclose
Name in quotes.
Example: addCustomBasemap(basemapName,URL,"Attribution","My
attribution") specifies the attribution for the custom basemap.
Attribution of the custom basemap, specified as a string scalar, string array, character vector, or cell array of character vectors. To create a multiline attribution, specify a string array or a nonscalar cell array of character vectors.
When you create a custom basemap from a URL, the default attribution is
'Tiles courtesy of
, where
DOMAIN_NAME_OF_URL'DOMAIN_NAME_OF_URLURL input argument. If the host is
'localhost', or if URL contains only IP
numbers, specify the attribution as an empty string ("").
When you create a custom basemap from an
MBTiles file with an attribution in the metadata, the
addCustomBasemap function gets the attribution from the file.
If the file does not contain an attribution, the default attribution is an empty
string.
When you add a basemap from vector map
tiles hosted by Esri, the addCustomBasemap function ignores this
argument and uses an attribution based on the location and zoom level.
Example: "Credit: U.S. Geological Survey"
Data Types: string | char | cell
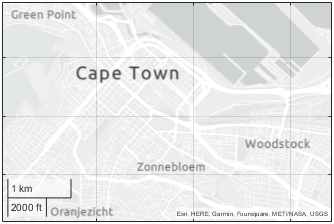
Style of the vector basemap, specified as a predefined style, the name of a JSON file, or a URL. The appearance of the basemap, such as the line colors and font names, depends on the style you specify when you add the basemap.
This table lists the predefined style options. The predefined style options do not require internet access.
| Value | Sample Image | Value | Description |
|---|---|---|---|
"streets-light" — Provides geographic context while
highlighting user data on a light background. |
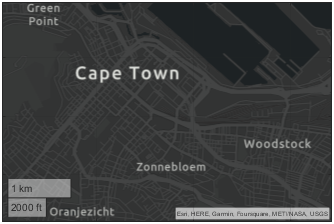
| "streets-dark" — Provides geographic context while
highlighting user data on a dark background. |
|
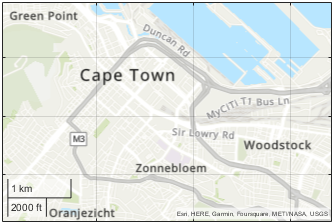
"streets" — Emphasizes roads and transit
networks. |
| "topographic" — Emphasizes topographic
features. |
|
"openstreetmap" — Uses colors based on OpenStreetMap®. |
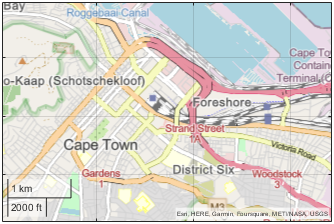
| "bluegreen" — Uses light green for land areas and
light blue for water areas. |
|
"grayland" — Uses gray for land areas and white for
water areas. |
| "darkwater" — Uses light gray for land areas and
dark gray for water areas. |
|


The default is "auto", which chooses a style based on the
MATLAB theme. When you select the light theme, "auto" uses
the "streets-light" style. When you select the dark theme,
"auto" uses the "streets-dark" style.
When you use a predefined style and specify the map tiles using an MBTiles file,
the addCustomBasemap function creates a JSON file with the style
information and places the file in the same folder as the MBTiles file. You can use
the JSON file to customize the appearance of the predefined basemap. For more
information, see Customize Appearance of Vector Basemaps.
When you specify the name of a JSON file, you must include the extension
.json. The way you specify the file depends on the location of
the file.
If the file is in your current folder or in a folder on the MATLAB path, then specify the name of the file, such as
"myFile.json".If the file is not in the current folder or in a folder on the MATLAB path, then specify the full or relative path name, such as
"C:/myfolder/myFile.json"or"dataDir/myFile.json".
JSON files can require internet access, for example, when the file specifies fonts or icons that are stored on a web server. When the file includes references to web servers, the paths must be full paths (not relative paths).
Style Limitations
The predefined styles use a font supported only in English locales.
Styles specified using URLs must include the transfer protocol. Only
httpsis supported.Styles specified using URLs and JSON files can contain attributes that the
addCustomBasemapfunction does not support. These unsupported attributes can affect the appearance of the basemap or can cause the function to issue an error.The
addCustomBasemapfunction creates the custom basemap by matching layers contained in the map tiles with layer IDs specified by the style. If the function fails to match a layer with a layer ID, then the basemap displays the geometry of the layer (such as polygon edges and lines) and does not display other aspects of the layer (such as points and text).Styles specified using URLs or JSON files from Esri can cause basemaps on globe viewers to appear in unexpected blue colors. These colors appear because the style specifies some layers as semitransparent instead of completely opaque. Within a JSON file, you can make layers completely opaque by changing values of the
"fill-opacity"properties to1. After you update the JSON file, you must add the custom basemap again.
Data Types: char | string
Display name of the custom basemap, specified as a string scalar or character vector.
The addToolbarMapButton function uses this name in the basemap
picker.
Example: "OpenStreetMap"
Data Types: string | char
Maximum zoom level of the basemap, specified as an integer in the range [0, 25].
When you create a custom basemap from an
MBTiles file with the maximum zoom level in the metadata, the
addCustomBasemap gets the maximum zoom level from the
file.
Data Types: single | double | int8 | int16 | int32 | int64 | uint8 | uint16 | uint32 | uint64
Map is deployable using MATLAB
Compiler, specified as a numeric or logical 0
(false) or 1 (true).
To deploy a map application that uses a
custom basemap, set IsDeployable to true. If you
create the custom basemap from an MBTiles file, then you must include the file in the
deployed application package, unless you deploy the application to the same computer
you used to compile the application or if the file is on a network file system that
the application can access from a different computer. You must set this argument
whether you use the addCustomBasemap function in your application
or outside your application.
Data Types: logical
Limitations
When you add a custom basemap from vector MBTiles files, text that crosses tile boundaries can appear clipped.
Tips
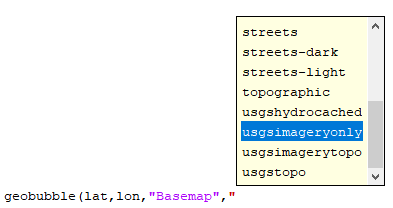
You can find tiled web maps from various vendors, such as OpenStreetMap, the USGS National Map, Mapbox, DigitalGlobe, Esri ArcGIS Online, the Geospatial Information Authority of Japan (GSI), and HERE Technologies. Abide by the map vendors terms-of-service agreement and include accurate attribution with the maps you use.
To access a list of available basemaps, press Tab before specifying the basemap in your plotting function. This image shows a sample list of available basemaps, including several custom basemaps from the USGS National Map.
Version History
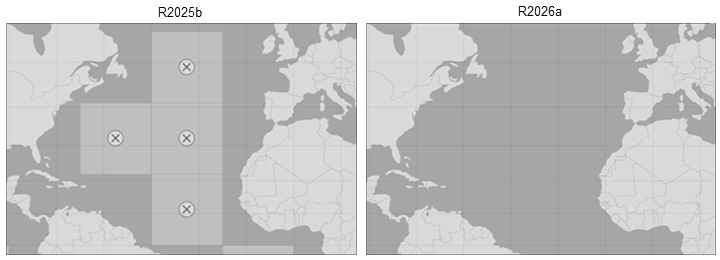
Introduced in R2018bCustom basemaps created from vector MBTiles files now display tiles with no data using
the background color defined by the Style argument of the
addCustomBasemap function. In previous releases, the basemap displays
missing tiles.
This image compares the same custom basemap added from a vector MBTiles file in R2025b and R2026a.
See Also
Functions
Properties
Objects
1 Alignment of boundaries and region labels are a presentation of the feature provided by the data vendors and do not imply endorsement by MathWorks®.