Measure and Monitor Project Quality
Measure and monitor the quality of MATLAB® code and tests in Projects by using the Code Quality Dashboard. The dashboard collects and displays quality metrics for the MATLAB code, test files, and requirement sets in the open project and its referenced projects. The dashboard displays metrics for code analysis, test results, code coverage and generated code coverage results, and requirements verification.
Monitor Quality Metrics
Open a project. Then, in the Project tab, in the Tools section, under Apps, click Code Quality Dashboard.
Note
By default, the dashboard prompts you to enable artifact tracing the first time you open a project. Click Enable and Continue to allow the dashboard to track tool outputs and detect outdated metric results.
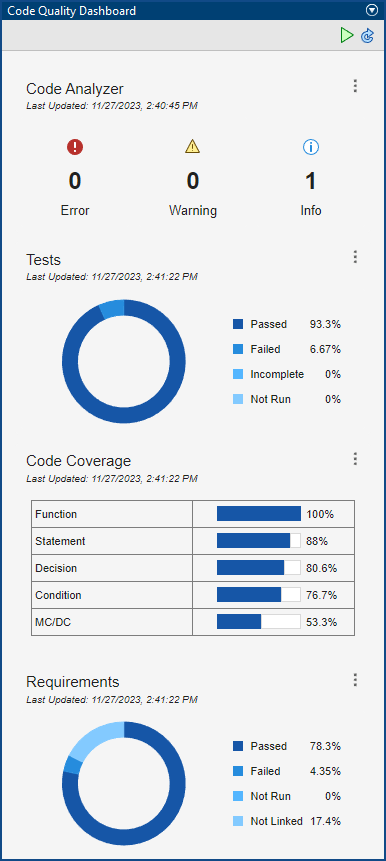
The dashboard has five sections:
Code Analyzer displays coding problems.
Tests displays test results.
Code Coverage displays code coverage results for MATLAB source code that executes when you run tests.
Generated Code Coverage displays code coverage results for generated C/C++ code that executes when you run SIL and PIL equivalence tests (since R2024b).
Requirements displays requirements verification status.
Each section of the dashboard displays a timestamp that indicates when the software collected the results (since R2023b).
Tip
You can programmatically retrieve the metrics by using the matlabtest.codequalitydashboard.getMetrics function.
Check for Coding Problems
The Code Analyzer section displays information about coding errors, warnings, and improvement opportunities for the MATLAB code and test files in your project.
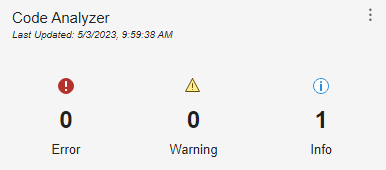
The Code Quality Dashboard uses the MATLAB Code Analyzer to check MATLAB code and test files in the project for coding problems. For more information on the MATLAB Code Analyzer, see Check Code for Errors and Warnings Using the Code Analyzer.
To collect and display code analyzer metric results, update the dashboard. For more information, see Update the Dashboard.
To view details about the coding problems, open the code analyzer report by clicking the Code Analyzer section. For more information, see MATLAB Code Analyzer Report.
Verify Code by Running Tests
The Tests section displays the current test results from the MATLAB Test Manager.
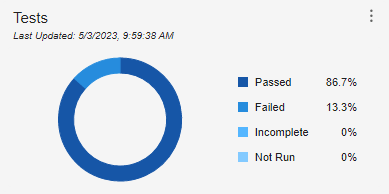
The MATLAB Test Manager manages MATLAB tests and test results for your project. For more information, see Manage Tests and Results by Using the MATLAB Test Manager.
To collect test metric results, run tests by using the MATLAB Test Manager. Running test suites or tests in the project updates the test metric results with aggregated results from multiple runs.
To view detailed test results, open the MATLAB Test Manager by clicking the Tests section.
Collect Code Coverage
The Code Coverage section displays code coverage results for MATLAB source code that executes when you run tests using the MATLAB Test Manager.
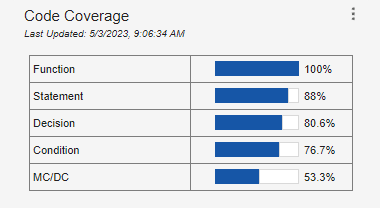
Code coverage indicates how thoroughly your tests execute functions, statements, or conditional logic in the code files. For more information, see Collect Code Coverage Metrics for MATLAB Source Code.
To collect and display code coverage metric results, enable coverage in the MATLAB Test Manager, then run all tests in the project. Running test suites or selected tests does not update the coverage metric results in the dashboard.
To view detailed code coverage results, open the code coverage report by clicking the Code Coverage section.
Collect Generated Code Coverage
Since R2024b
If you have Embedded Coder®, the Generated Code Coverage section displays code coverage results for generated C/C++ code that executes when you run SIL and PIL equivalence tests using the MATLAB Test Manager.
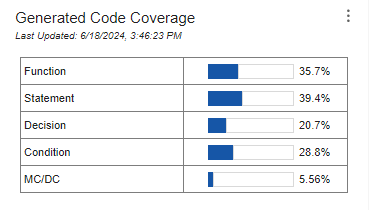
Generated code coverage indicates how thoroughly your equivalence tests execute functions, statements, or conditional logic in the code files in your generated C/C++ code. For more information, see Collect Coverage for Generated C/C++ Code in Equivalence Tests.
To collect and display generated code coverage metric results, enable coverage in the MATLAB Test Manager, then run all tests in the project. Running test suites or selected tests does not update the coverage metric results in the dashboard.
To view detailed generated code coverage results, open the generated code coverage report by clicking the Generated Code Coverage section.
Verify Requirements
If you have Requirements Toolbox™, the Requirements section displays the requirements verification status for the requirements in the project.
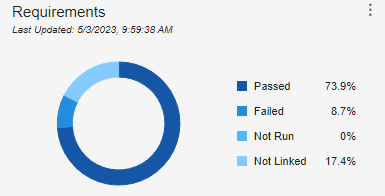
In Requirements Toolbox, the requirements verification status reflects the results of verification items linked to requirements, including Simulink® tests. In the Code Quality Dashboard, the requirements verification status reflects only the test results for linked MATLAB tests from the MATLAB Test Manager. For more information, see Verify Requirements in Projects with MATLAB Tests.
To collect requirements metric results, run tests by using the MATLAB Test Manager or the Code Quality Dashboard. Running test suites or tests updates the requirements metric results with aggregated results from multiple runs.
To view the requirements in the project, open the Requirements Editor (Requirements Toolbox) by clicking the Requirements section.
To create a traceability matrix that contains the
requirements and tests in the project, click the three-dot icon
![]() and select Generate Traceability
Matrix (since R2024b). The Traceability Matrix window opens and displays
the loaded requirement sets on the top and the tests on the left.
and select Generate Traceability
Matrix (since R2024b). The Traceability Matrix window opens and displays
the loaded requirement sets on the top and the tests on the left.
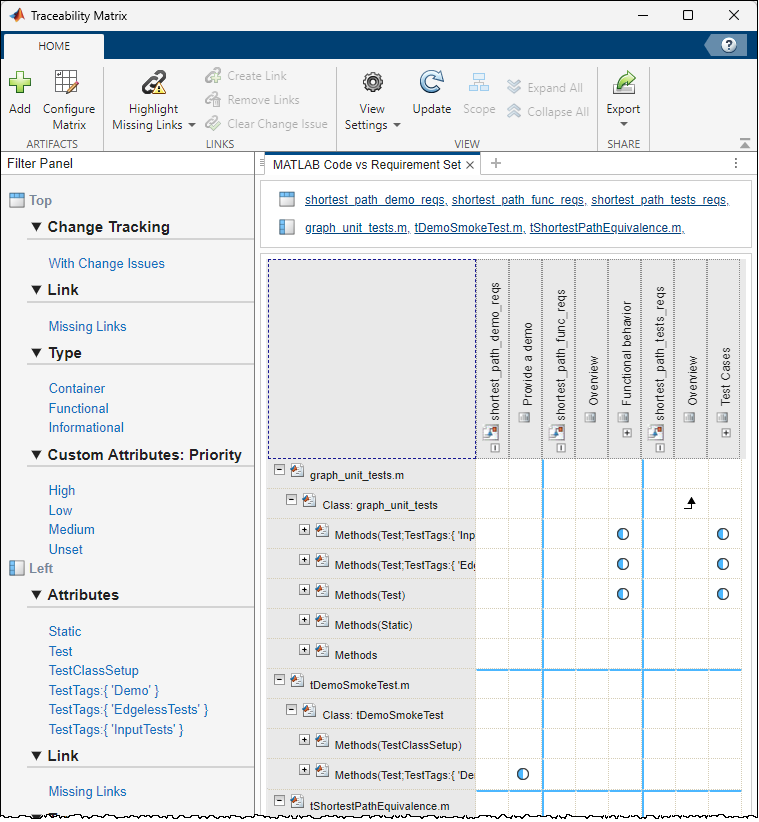
When you use the Code Quality Dashboard to open the requirements in the project or create a traceability matrix, a dialog box prompts you to close open requirement sets that are not in the project. If you do not close the requirement sets, the software leaves them open in the Requirements Editor and includes them in the traceability matrix. (since R2024b)
Update the Dashboard
Monitor the quality of your project as you make changes and collect new results by updating the metrics. You can update all metrics in the dashboard, update individual sections, or collect new metrics by running tests.
Update Metrics
When you make changes to artifacts in the project or collect new results, a banner indicates that the project artifacts have changed and that the results might be stale.
![]()
To retrieve the current status of the project artifacts and refresh all of the results in the dashboard, click Refresh Metrics.
Run Tests and Update Metrics
To simultaneously run tests and update metric results for the
Tests, Code Coverage, and
Requirements sections, click the three-dot icon
![]() in one of those sections and select
Run Tests and Refresh Data.
in one of those sections and select
Run Tests and Refresh Data.
Collect New Metrics by Running Tests
Since R2024a
You can collect new metrics by clicking the Run button ![]() .
.
Clicking the Run button ![]() :
:
Runs all tests in the open project and its referenced projects
Collects coverage for the tests
Verifies requirements that link to the tests
Note
Clicking the Run button ![]() in the Code Quality Dashboard collects
coverage using the metric level specified in the MATLAB Test Manager. The
dashboard enables and collects coverage even if coverage is disabled in the MATLAB
Test Manager.
in the Code Quality Dashboard collects
coverage using the metric level specified in the MATLAB Test Manager. The
dashboard enables and collects coverage even if coverage is disabled in the MATLAB
Test Manager.
To stop the tests from running to completion, click the Stop button
![]() .
.
Alternatively, you can collect new metrics by using the matlabtest.codequalitydashboard.runTestsAndRefreshData
function.
Export Code Quality Metrics
Since R2024a
You can export current results in the Code Quality Dashboard to a JSON file
by using the matlabtest.codequalitydashboard.exportMetrics function.
See Also
Apps
Functions
matlabtest.codequalitydashboard.runTestsAndRefreshData|matlabtest.codequalitydashboard.getMetrics|matlabtest.codequalitydashboard.exportMetrics