Display Interactive Graphics on Webpages
Display interactive graphics on a webpage by creating an HTML file that contains a web canvas. A web canvas enables some plot interactions without the need for a MATLAB® license. Some visualizations in a web canvas support pan, zoom, and rotate interactions. Like vector graphics, web canvases provide graphics that remain sharp regardless of zoom level. You can open your HTML files using a web browser with an internet connection, share the files with others, or host them on a web server.
There are two ways to create an HTML file with a web canvas:
Export an object from a figure.
Export a live script.
Export Object from Figure
To create an HTML file containing just your graphic in a web canvas, use the
exportgraphics function. When you call this function, specify the
object you want to export and the name of the HTML file as input arguments.
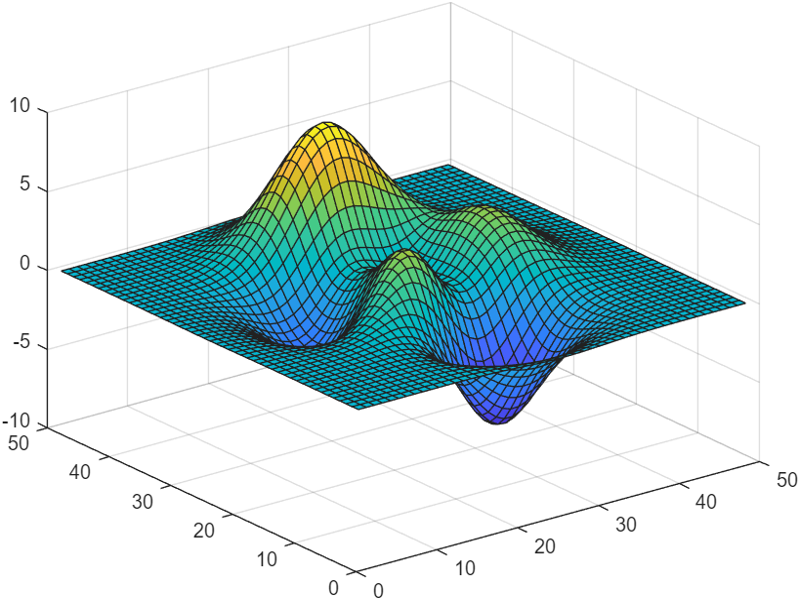
For example, create a surface plot and export the contents of the figure as an HTML file.
surf(peaks)
exportgraphics(gcf,"mysurfaceplot.html")
You can interact with this plot by dragging or scrolling within the plot box or by dragging any of the axes to change the limits.
Export Live Script
To create an HTML file that contains text and code along with interactive
graphics, create a live script and export it as an HTML file using the web canvas
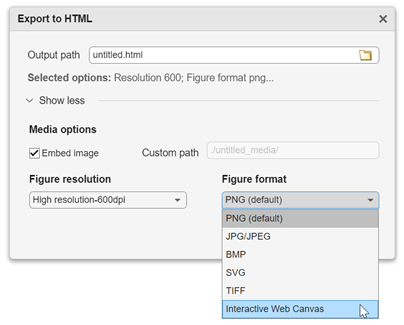
option. With your live script open in the Live Editor, select Export > Export to HTML. In the Export to HTML dialog box, set the destination file path in
the Output path box. Expand the Show more section, and set Figure
format to Interactive Web Canvas.
(Alternatively, you can use the export function to export a live script programmatically.)
Limitations
You can expect sharp, high-quality graphics when you display any type of plot in a web canvas. However, interactions are limited in some cases. Use this table to assess whether a web canvas supports interactions for your graphics.
| Graphics Functionality | Interaction Support |
|---|---|
Types of axes | Supported:
Not Supported:
|
Types of interactions | Supported:
Not Supported:
|
Types of plots and data | Supported:
Not Supported: Interactions are not supported for:
|
Apps | Not Supported:
|
Security Considerations for Interactive Web Canvases
Avoid including sensitive information in your HTML file. The graphics content and data are encoded but not encrypted, which can allow third parties to extract the information.