在时间表中选择时间
时间表是一种表类型,用于将时间与每一行进行关联。您可以通过几种方式选择基于时间的数据子集:
使用
timerange或withtol函数查找特定范围内的时间。使用
datetime数组的分量匹配重复出现的时间单位,如天或月。使用
retime函数对数据进行重采样或分组。
例如,读取示例文件 outages.csv,其中包含 2002 年至 2014 年美国电力中断的数据。行时间向量 OutageTime 表示电力中断发生的时间。readtimetable 函数将其作为 datetime 数组导入。要将文本作为字符串数组导入,请将 TextType 名称-值参量指定为 "string"。
TT = readtimetable("outages.csv",TextType="string")
TT=1468×5 timetable
       OutageTime         Region        Loss     Customers     RestorationTime           Cause
    ________________    ___________    ______    __________    ________________    _________________

    2002-02-01 12:18    "SouthWest"    458.98    1.8202e+06    2002-02-07 16:50    "winter storm"
    2003-01-23 00:49    "SouthEast"    530.14    2.1204e+05                 NaT    "winter storm"
    2003-02-07 21:15    "SouthEast"     289.4    1.4294e+05    2003-02-17 08:14    "winter storm"
    2004-04-06 05:44    "West"         434.81    3.4037e+05    2004-04-06 06:10    "equipment fault"
    2002-03-16 06:18    "MidWest"      186.44    2.1275e+05    2002-03-18 23:23    "severe storm"
    2003-06-18 02:49    "West"              0             0    2003-06-18 10:54    "attack"
    2004-06-20 14:39    "West"         231.29           NaN    2004-06-20 19:16    "equipment fault"
    2002-06-06 19:28    "West"         311.86           NaN    2002-06-07 00:51    "equipment fault"
    2003-07-16 16:23    "NorthEast"    239.93         49434    2003-07-17 01:12    "fire"
    2004-09-27 11:09    "MidWest"      286.72         66104    2004-09-27 16:37    "equipment fault"
    2004-09-05 17:48    "SouthEast"    73.387         36073    2004-09-05 20:46    "equipment fault"
    2004-05-21 21:45    "West"         159.99           NaN    2004-05-22 04:23    "equipment fault"
    2002-09-01 18:22    "SouthEast"    95.917         36759    2002-09-01 19:12    "severe storm"
    2003-09-27 07:32    "SouthEast"       NaN    3.5517e+05    2003-10-04 07:02    "severe storm"
    2003-11-12 06:12    "West"         254.09    9.2429e+05    2003-11-17 02:04    "winter storm"
    2004-09-18 05:54    "NorthEast"         0             0                 NaT    "equipment fault"
      ⋮
选择时间范围
要查找特定范围内的数据,您可以使用 timerange 函数,该函数定义基于时间的下标来进行索引。例如,定义 2008 年夏季,也就是从 6 月 20 日开始到 9 月 21 日结束,的范围。默认情况下,timerange 定义半开区间,左边关闭,右边打开,因此将结束日期指定为 9 月 22 日。
TR = timerange("2008-06-20","2008-09-22")
TR =
	timetable timerange subscript:

		Select timetable rows with times in the half-open interval:
		  Starting at, including:   20-Jun-2008 00:00:00
		  Ending at, but excluding: 22-Sep-2008 00:00:00

	See Select Times in Timetable.
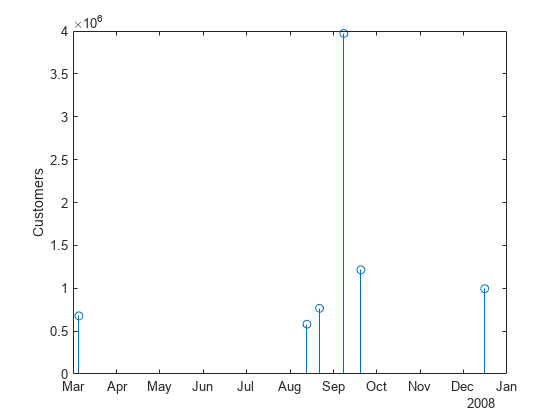
找出在该范围内发生的电力中断,然后对受影响的客户数量绘制随时间变化的图。
summer08 = TT(TR,:);
stem(summer08.OutageTime,summer08.Customers)
ylabel("Customers")
在此时间范围内的几次电力中断对客户产生很大影响。将范围扩大到 2008 年全年,并寻找类似的高值数字。
TR = timerange("2008","years");
all08 = TT(TR,:);
high08 = all08(all08.Customers > 500000,:);

stem(high08.OutageTime,high08.Customers)
ylabel("Customers")
timerange 函数也有助于选择特定日期。通过比较 datetime 值来选择时间可能会产生错误结果,因为所有 datetime 值都包含日期和时间分量。但是,当您仅指定 datetime 值的日期分量时,时间分量将设置为午夜。因此,虽然存在从 6 月 26 日以来的数据,但像这样的比较不会返回结果。
any(summer08.OutageTime == datetime("2008-06-26"))ans = logical
0
您可以改用 timerange。
TR = timerange("2008-06-26","days");
june26 = summer08(TR,:)
june26=1×5 timetable
       OutageTime         Region        Loss     Customers    RestorationTime          Cause
    ________________    ___________    ______    _________    ________________    _______________

    2008-06-26 22:36    "NorthEast"    425.21      93612      2008-06-27 06:53    "thunder storm"
定义范围的另一种方法是使用 withtol 指定一段时间内的容差。例如,查找从 2008 年夏天以来的行,其中 OutageTime 在 9 月 1 日劳动节的三天内。
WT = withtol("2008-09-01",days(3));
nearSep1 = summer08(WT,:)nearSep1=4×5 timetable
OutageTime Region Loss Customers RestorationTime Cause
________________ ___________ ______ _________ ________________ _________________
2008-09-01 23:35 "SouthEast" 206.27 2.27e+05 NaT "equipment fault"
2008-09-01 00:18 "MidWest" 510.05 74213 2008-09-01 14:07 "thunder storm"
2008-09-02 19:01 "MidWest" NaN 2.215e+05 2008-09-03 02:58 "severe storm"
2008-08-29 20:25 "West" NaN 31624 2008-09-01 01:51 "wind"
匹配时间单位
您还可以使用 datetime 值的单位(如小时或天)来标识用于逻辑索引的行。这种方法对于指定周期性间隔很有用。
例如,查找 OutageTime 的值,其月份分量的值等于或小于 3,对应于每年的 1 月、2 月和 3 月。使用生成的逻辑数组对 TT 进行索引。
TR = (month(TT.OutageTime) <= 3);
winterTT = TT(TR,:)
winterTT=316×5 timetable
       OutageTime         Region        Loss     Customers     RestorationTime           Cause
    ________________    ___________    ______    __________    ________________    __________________

    2002-02-01 12:18    "SouthWest"    458.98    1.8202e+06    2002-02-07 16:50    "winter storm"
    2003-01-23 00:49    "SouthEast"    530.14    2.1204e+05                 NaT    "winter storm"
    2003-02-07 21:15    "SouthEast"     289.4    1.4294e+05    2003-02-17 08:14    "winter storm"
    2002-03-16 06:18    "MidWest"      186.44    2.1275e+05    2002-03-18 23:23    "severe storm"
    2005-02-04 08:18    "MidWest"         NaN           NaN    2005-02-04 19:51    "attack"
    2005-03-08 16:37    "SouthEast"    1339.2    4.3003e+05    2005-03-10 20:42    "winter storm"
    2002-03-26 01:59    "MidWest"      388.04    5.6422e+05    2002-03-28 19:55    "winter storm"
    2003-03-27 08:03    "NorthEast"    204.79     1.479e+05    2003-03-28 05:54    "severe storm"
    2003-02-24 06:13    "SouthEast"         0             0    2003-02-24 21:18    "attack"
    2002-03-05 17:53    "MidWest"      96.563    2.8666e+05    2002-03-10 14:41    "wind"
    2006-01-21 21:27    "SouthEast"    19.513         10994    2006-01-21 23:25    "equipment fault"
    2004-01-19 12:37    "MidWest"       16.03        2.2296    2004-01-20 02:50    "equipment fault"
    2005-03-01 14:39    "West"         115.47         82611    2005-03-03 05:58    "equipment fault"
    2003-01-10 15:38    "West"         185.85     2.757e+05    2003-01-12 05:48    "winter storm"
    2004-01-14 20:01    "NorthEast"     87.08         14979    2004-01-16 00:52    "energy emergency"
    2004-01-04 10:45    "NorthEast"    145.86         27942    2004-01-08 19:34    "energy emergency"
      ⋮
创建一个冬季时间原因的饼图。pie 函数只接受数值或 categorical 输入,因此首先将 Cause 转换为 categorical。
winterTT.Cause = categorical(winterTT.Cause);
pie(winterTT.Cause)
title("Causes of Outages, January to March");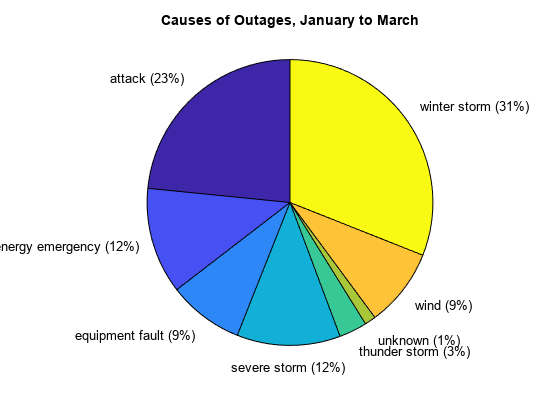
按时间段分组
retime 函数通过对值进行重采样或分组来调整行时间,以创建指定的间隔。其预定义间隔从秒到年不等,您可以指定如何处理间隔的缺失值或多个值。例如,您可以选择每周的第一个观测值,或对一个季度的观测值进行计数。
对于电力中断数据,您可以使用 retime 来查找每年的总数。首先,创建一个只包含数值变量的时间表。然后,调用 retime 并指定年度间隔,用总和组合多个值。输出中每年对应一个行,包含该年的总损失和受影响的客户总数。
numTT = TT(:,vartype("numeric"));
numTT = retime(numTT,"yearly","sum")
numTT=13×2 timetable
       OutageTime       Loss     Customers
    ________________    _____    __________

    2002-01-01 00:00    81335    1.3052e+07
    2003-01-01 00:00    58036     1.396e+07
    2004-01-01 00:00    51014    1.5523e+07
    2005-01-01 00:00    33980    8.7334e+06
    2006-01-01 00:00    35129    2.5729e+07
    2007-01-01 00:00    29112    1.2494e+07
    2008-01-01 00:00    34608    1.7608e+07
    2009-01-01 00:00    15487    1.1785e+07
    2010-01-01 00:00    51543    2.7614e+07
    2011-01-01 00:00    34834    1.3614e+07
    2012-01-01 00:00    42548    1.8905e+07
    2013-01-01 00:00    19572    1.1284e+07
    2014-01-01 00:00        0             0
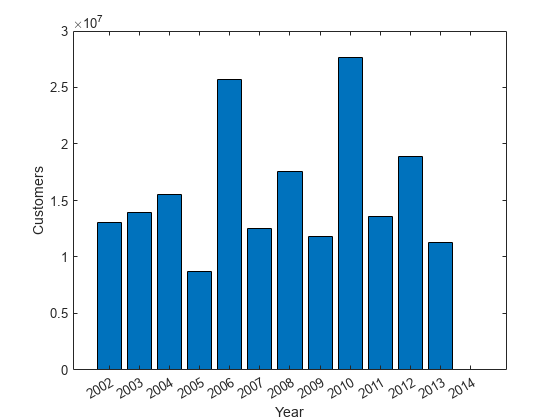
创建一个条形图,显示每年受影响的客户数量。
bar(numTT.OutageTime,numTT.Customers)
xlabel("Year")
ylabel("Customers")
使用行时间计算持续时间
您可以将时间表的行时间与其他 datetime 或 duration 值结合使用来执行计算。例如,计算电力中断数据中列出的停电持续时间。然后计算每月电力中断持续时间的中位数并对其绘图。
首先,通过从 RestorationTime(即停电结束时间)中减去行时间(即停电开始时间),将电力中断持续时间添加到 TT。更改 OutageDuration 的格式,以天为单位显示电力中断的持续时间。
TT.OutageDuration = TT.RestorationTime - TT.OutageTime;
TT.OutageDuration.Format = "d"TT=1468×6 timetable
OutageTime Region Loss Customers RestorationTime Cause OutageDuration
________________ ___________ ______ __________ ________________ _________________ ______________
2002-02-01 12:18 "SouthWest" 458.98 1.8202e+06 2002-02-07 16:50 "winter storm" 6.1889 days
2003-01-23 00:49 "SouthEast" 530.14 2.1204e+05 NaT "winter storm" NaN days
2003-02-07 21:15 "SouthEast" 289.4 1.4294e+05 2003-02-17 08:14 "winter storm" 9.4576 days
2004-04-06 05:44 "West" 434.81 3.4037e+05 2004-04-06 06:10 "equipment fault" 0.018056 days
2002-03-16 06:18 "MidWest" 186.44 2.1275e+05 2002-03-18 23:23 "severe storm" 2.7118 days
2003-06-18 02:49 "West" 0 0 2003-06-18 10:54 "attack" 0.33681 days
2004-06-20 14:39 "West" 231.29 NaN 2004-06-20 19:16 "equipment fault" 0.19236 days
2002-06-06 19:28 "West" 311.86 NaN 2002-06-07 00:51 "equipment fault" 0.22431 days
2003-07-16 16:23 "NorthEast" 239.93 49434 2003-07-17 01:12 "fire" 0.36736 days
2004-09-27 11:09 "MidWest" 286.72 66104 2004-09-27 16:37 "equipment fault" 0.22778 days
2004-09-05 17:48 "SouthEast" 73.387 36073 2004-09-05 20:46 "equipment fault" 0.12361 days
2004-05-21 21:45 "West" 159.99 NaN 2004-05-22 04:23 "equipment fault" 0.27639 days
2002-09-01 18:22 "SouthEast" 95.917 36759 2002-09-01 19:12 "severe storm" 0.034722 days
2003-09-27 07:32 "SouthEast" NaN 3.5517e+05 2003-10-04 07:02 "severe storm" 6.9792 days
2003-11-12 06:12 "West" 254.09 9.2429e+05 2003-11-17 02:04 "winter storm" 4.8278 days
2004-09-18 05:54 "NorthEast" 0 0 NaT "equipment fault" NaN days
⋮
创建一个只包含电力中断持续时间的时间表。TT 中某些行的停电结束时间为缺失值 NaT,导致 OutageDuration 中出现 NaN 值。要从 medianTT 中删除 NaN 值,请使用 rmmissing 函数。然后使用 retime 计算每月电力中断持续时间中位数。
medianTT = TT(:,"OutageDuration");
medianTT = rmmissing(medianTT);
medianTT = retime(medianTT,"monthly",@median)
medianTT=143×1 timetable
       OutageTime       OutageDuration
    ________________    ______________

    2002-02-01 00:00      6.1889 days
    2002-03-01 00:00      2.7472 days
    2002-04-01 00:00         NaN days
    2002-05-01 00:00     0.72917 days
    2002-06-01 00:00     0.22431 days
    2002-07-01 00:00     0.64653 days
    2002-08-01 00:00     0.49514 days
    2002-09-01 00:00     0.10139 days
    2002-10-01 00:00      2.3451 days
    2002-11-01 00:00     0.12222 days
    2002-12-01 00:00      2.0243 days
    2003-01-01 00:00      1.5903 days
    2003-02-01 00:00      3.2955 days
    2003-03-01 00:00     0.47326 days
    2003-04-01 00:00     0.95347 days
    2003-05-01 00:00      2.2882 days
      ⋮
创建每月电力中断持续时间中位数的阶梯图。
stairs(medianTT.OutageTime,medianTT.OutageDuration)
xlabel("Year")
ylabel("Median Duration (days)")

另请参阅
categorical | timetable | retime | timerange | readtimetable | month | withtol | rmmissing | vartype | datetime | duration | NaT