rfplot
Description
rfplot(___, plots the spur
and the spur-free zones of the Name=Value)mixerIMT object using additional options.
Specify the name-value argument after any of the input argument combinations in the previous
syntaxes. (since R2024a)
Examples
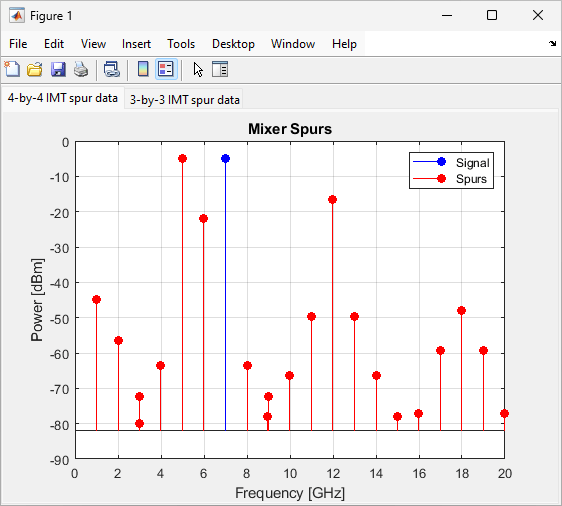
Create an IMT mixer with the LO frequency of 5995 MHz and with the IMT spurs.
imt = mixerIMT(LO=5995e6,IMT=...
     [99 17 13.6 42.9; 40 0 47.7 54.3; 50.4 58.5 61.3 72.2; 75 67.4 75 99]);
Plot the mixer spur at an input signal frequency of 1005 MHz.
rfplot(imt,1005e6)
![Figure contains an axes object. The axes object with title Mixer Spurs, xlabel Frequency [GHz], ylabel Power [dBm] contains 2 objects of type stem. These objects represent Signal, Spurs.](../../examples/rf/win64/PlotMixerSpurOfIMTMixerExample_01.png)
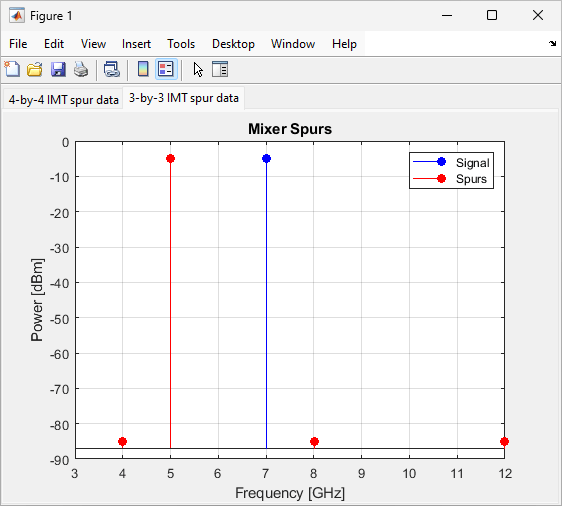
Create an IMT mixer with 4-by-4 IMT spur data.
imt = mixerIMT(LO=5995e6,IMT=...
     [99 17 11.6 42.9; 40 0 44.7 54.3; 51.4 58.5 61.3 72.2; 75 67.4 73 99]);
Create an IMT mixer with 3-by-3 IMT spur data.
imt2 = mixerIMT(LO=5995e6,IMT=...
     [99 99 80; 99 0 99; 99 80 99]);
Type these commands at the command line to create a rfplot figure with two tabs. Add axes to each tab by specifying the parent container for each axis. Plot the IMT mixer with the 4-by-4 IMT spur data in the first tab and the IMT mixer with the 3-by-3 IMT spur data in the second tab.
figure
tab1 = uitab('Title','4-by-4 IMT spur data');
ax3 = axes(tab1);
rfplot(ax3,imt,1005e6)

tab2 = uitab('Title','3-by-3 IMT spur data');
ax4 = axes(tab2);
rfplot(ax4,imt2,1005e6)
Since R2024a
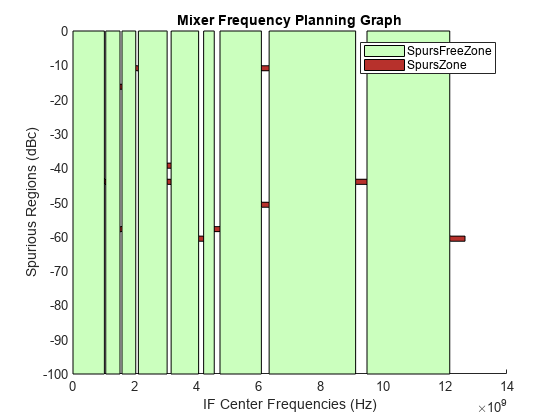
Create a mixerIMT object and specify the IMT data.
m = mixerIMT(IMT= [99 17 11.6; 40 0 44.7; 51.4 58.5 61.3]);
Specify the RF bandwidth as 120 MHz and the IF bandwidth as 10 MHz as inputs to the rfplot function in order to visualize the spur and spur-free zones of the mixerIMT object.
rfplot(m,"Frequency",3.1e9,"RFBW",120e6,"IFBW",10e6)
Input Arguments
Name-Value Arguments
Tips
In addition to plotting the mixer spurs, you can also use the rfplot function to:
Plot the S-parameter data.
Plot the cumulative RF budget result versus the cascade input frequency.
Plot the input reflection coefficient and transducer gain of a matching network.