risk.validation.kolmogorovSmirnovPlot
Syntax
Description
risk.validation.kolmogorovSmirnovPlot(
creates two data samples from Score,BinaryResponse)Score and
BinaryResponse, then plots their empirical cumulative distribution
functions (CDF). The plot also includes dotted lines indicating the location of the
empirical CDFs' largest absolute difference, which is the value of the Kolmogorov-Smirnov
(KS) statistic.
risk.validation.kolmogorovSmirnovPlot(
plots the empirical CDFs for the data in Sample1,Sample2)Sample1 and
Sample2 together with dotted lines indicating the location of the
empirical CDFs' largest absolute difference.
risk.validation.kolmogorovSmirnovPlot(___,
specifies additional options using one or more name-value arguments. For example, you can
specify the direction in which to sort the distribution variable and whether to plot the
absolute differences of the empirical CDFs.Name=Value)
h = risk.validation.kolmogorovSmirnovPlot(___)
Examples
Load the CreditValidationData data.
load CreditValidationData.matThe variables ScoreCardPD and Default in the PDModelsValidationData table, respectively, contain data for customer probability of default (PD) and whether the customer defaulted.
Visualize the Kolmogorov-Smirnov (KS) statistic for the numeric data in ScoreCardPD, grouped by the logical data in Default.
ScorecardPD = PDModelsValidationData.ScorecardPD;
Default = PDModelsValidationData.Default;
risk.validation.kolmogorovSmirnovPlot(ScorecardPD,Default)
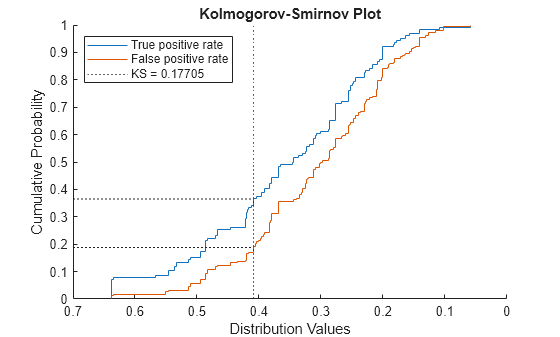
The plot shows the empirical cumulative distribution function (CDF) for customers who defaulted in blue with the label True positive rate and the empirical CDF for the customers who did not default in orange with the label False positive rate. The horizontal axis represents the values in ScoreCardPD. The true and false positive rates correspond to different values in ScoreCardPD which, if used as a classification threshold, would result in the plotted true positive and false positive rates. The rates for each threshold assume that all values to the left are classified as 1 (defaulted) while values to the right are classified as 0 (not defaulted). The dotted lines indicate the largest absolute difference between the CDFs and the score associated with it. The largest absolute distance is the KS statistic.
Load the profit and loss sample data.
load("PandLValues.mat")The vectors HPL and RTPL contain hypothetical loss (HPL) and risk-theoretical loss (RTPL) data for 250 trading days, or one year, of a simulated portfolio.
Plot the empirical CDFs for the data in HPL and RTPL together with the absolute difference between the CDFs.
risk.validation.kolmogorovSmirnovPlot(RTPL,HPL,PlotDifferences=true)
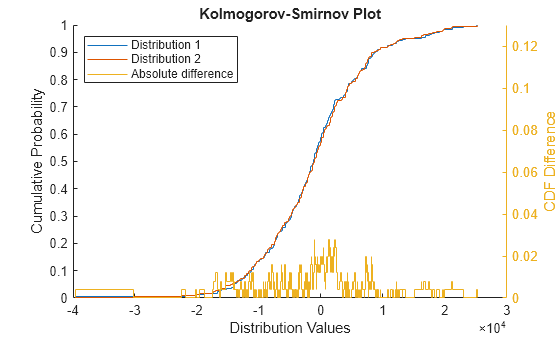
The plot shows the CDFs together with their absolute difference for each value of HPL and RTPL. The absolute difference reaches a maximum of 0.028 near 0.
Input Arguments
Name-Value Arguments
Output Arguments
Algorithms
To calculate the two-sample KS statistic,
risk.validation.kolmogorovSmirnovPlot calculates the empirical CDF for each sample. The KS
statistic is the largest absolute difference between the empirical CDFs.
Alternative Functionality
You can use the risk.validation.kolmogorovSmirnov function to calculate the KS statistic without
visualization.
References
[1] Basel Committee on Banking Supervision, "Calculation of RWA for market risk." January, 2022. https://www.bis.org/basel_framework/chapter/MAR/32.htm?inforce=20220101&published=20191215.
Version History
Introduced in R2026a