lookupPose
Syntax
Description
[
returns the pose information of the polynomial trajectory at the specified sample times. If
any sample time is beyond the duration of the trajectory, the function returns the
corresponding pose information as position,orientation,velocity,acceleration,angularVelocity] = lookupPose(trajectory,sampleTimes)NaN.
Examples
Use the minsnappolytraj function to generate the piecewise polynomial and the time samples for the specified waypoints of a trajectory.
waypoints = [0 20 20 0 0; 0 0 5 5 0; 0 5 10 5 0];
timePoints = linspace(0,30,5);
numSamples = 100;
[~,~,~,~,~,pp,~,~] = minsnappolytraj(waypoints,timePoints,numSamples);
Use the polynomialTrajectory System object™ to generate a trajectory from the piecewise polynomial. Specify the sample rate of the trajectory.
traj = polynomialTrajectory(pp,SampleRate=100);
Inspect the waypoints and times of arrival by using waypointInfo.
waypointInfo(traj)
ans=5×2 table
    TimeOfArrival                   Waypoints
    _____________    ________________________________________

           0                  0              0              0
         7.5                 20              0              5
          15                 20              5             10
        22.5                  0              5              5
          30         2.4897e-13    -2.7471e-12    -2.6352e-12
Obtain the time of arrival between the second and fourth waypoint. Create timestamps to sample the trajectory.
t0 = traj.TimeOfArrival(2);
tf = traj.TimeOfArrival(4);
sampleTimes = linspace(t0,tf,1000);
Obtain the position, orientation, velocity, and acceleration information at the sampled timestamps using the lookupPose object function.
[pos,orient,vel,accel,~] = lookupPose(traj,sampleTimes);
Get the yaw angle from the orientation.
eulOrientation = quat2eul(orient);
yawAngle = eulOrientation(:,1);
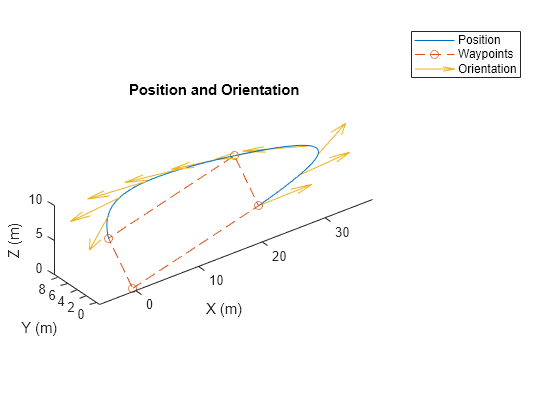
Plot the generated positions and orientations, as well as the specified waypoints.
plot3(pos(:,1),pos(:,2),pos(:,3), ...
      waypoints(1,:),waypoints(2,:),waypoints(3,:),"--o")
hold on
% Plot the yaw using quiver.
quiverIdx = 1:100:length(pos);
quiver3(pos(quiverIdx,1),pos(quiverIdx,2),pos(quiverIdx,3), ...
        cos(yawAngle(quiverIdx)),sin(yawAngle(quiverIdx)), ...
        zeros(numel(quiverIdx),1))
title("Position and Orientation")
xlabel("X (m)")
ylabel("Y (m)")
zlabel("Z (m)")
legend({"Position","Waypoints","Orientation"})
axis equal
hold off
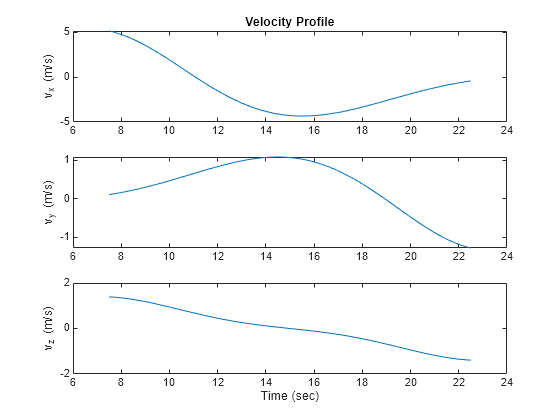
Plot the velocity profiles.
figure
subplot(3,1,1)
plot(sampleTimes,vel(:,1))
title("Velocity Profile")
ylabel("v_x (m/s)")
subplot(3,1,2)
plot(sampleTimes,vel(:,2))
ylabel("v_y (m/s)")
subplot(3,1,3)
plot(sampleTimes,vel(:,3))
ylabel("v_z (m/s)")
xlabel("Time (sec)")
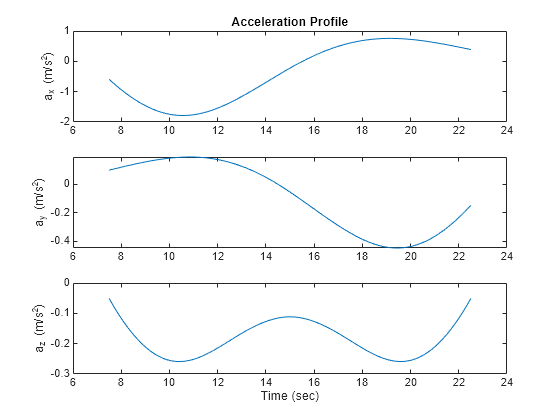
Plot the acceleration profiles.
figure
subplot(3,1,1)
plot(sampleTimes,accel(:,1))
title("Acceleration Profile")
ylabel("a_x (m/s^2)")
subplot(3,1,2)
plot(sampleTimes,accel(:,2))
ylabel("a_y (m/s^2)")
subplot(3,1,3)
plot(sampleTimes,accel(:,3))
ylabel("a_z (m/s^2)")
xlabel("Time (sec)")
Input Arguments
Output Arguments
Version History
Introduced in R2023a