waypointInfo
Description
trajectoryInfo = waypointInfo(trajectory)
Examples
Use the minjerkpolytraj function to generate the piecewise polynomial and the time samples for the specified waypoints of a trajectory.
waypoints = [0 20 20 0 0; 0 0 5 5 0; 0 5 10 5 0];
timePoints = cumsum([0 10 1.25*pi 10 1.25*pi]);
numSamples = 100;
[~,~,~,~,pp,~,tsamples] = minjerkpolytraj(waypoints,timePoints,numSamples);
Use the polynomialTrajectory System object™ to generate a trajectory from the piecewise polynomial that a multirotor must follow. Specify the sample rate of the trajectory and the orientation at each waypoint.
eulerAngles = [0 0 0; 0 0 0; 180 0 0; 180 0 0; 0 0 0];
q = quaternion(eulerAngles,"eulerd","ZYX","frame");
traj = polynomialTrajectory(pp,SampleRate=100,Orientation=q);
Inspect the waypoints, times of arrival, and orientation by using waypointInfo.
waypointInfo(traj)
ans=5×3 table
    TimeOfArrival                   Waypoints                      Orientation
    _____________    ________________________________________    ________________

            0                 0              0              0    {1×1 quaternion}
           10                20              0              5    {1×1 quaternion}
       13.927                20              5             10    {1×1 quaternion}
       23.927                 0              5              5    {1×1 quaternion}
       27.854        6.8449e-14    -1.2168e-13    -6.4837e-14    {1×1 quaternion}
Obtain pose information one buffer frame at a time.
[pos,orient,vel,acc,angvel] = traj();
i = 1;
spf = traj.SamplesPerFrame;
while ~isDone(traj)
    idx = (i+1):(i+spf);
    [pos(idx,:),orient(idx,:), ...
     vel(idx,:),acc(idx,:),angvel(idx,:)] = traj();
    i = i + spf;
end
Get the yaw angle from the orientation.
eulOrientation = quat2eul(orient);
yawAngle = eulOrientation(:,1);
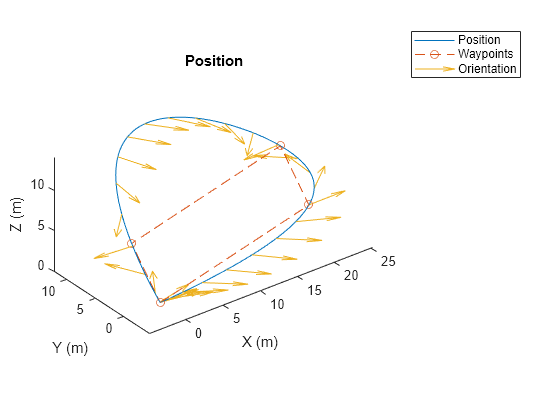
Plot the generated positions and orientations, as well as the specified waypoints.
plot3(pos(:,1),pos(:,2),pos(:,3), ...
      waypoints(1,:),waypoints(2,:),waypoints(3,:),"--o")
hold on
% Plot the yaw using quiver.
quiverIdx = 1:100:length(pos);
quiver3(pos(quiverIdx,1),pos(quiverIdx,2),pos(quiverIdx,3), ...
        cos(yawAngle(quiverIdx)),sin(yawAngle(quiverIdx)), ...
        zeros(numel(quiverIdx),1))
title("Position")
xlabel("X (m)")
ylabel("Y (m)")
zlabel("Z (m)")
legend({"Position","Waypoints","Orientation"})
axis equal
hold off

Use the minsnappolytraj function to generate the piecewise polynomial and the time samples for the specified waypoints of a trajectory.
waypoints = [0 20 20 0 0; 0 0 5 5 0; 0 5 10 5 0];
timePoints = linspace(0,30,5);
numSamples = 100;
[~,~,~,~,~,pp,~,~] = minsnappolytraj(waypoints,timePoints,numSamples);
Use the polynomialTrajectory System object™ to generate a trajectory from the piecewise polynomial. Specify the sample rate of the trajectory.
traj = polynomialTrajectory(pp,SampleRate=100);
Inspect the waypoints and times of arrival by using waypointInfo.
waypointInfo(traj)
ans=5×2 table
    TimeOfArrival                   Waypoints
    _____________    ________________________________________

           0                  0              0              0
         7.5                 20              0              5
          15                 20              5             10
        22.5                  0              5              5
          30         6.5364e-14    -2.6699e-12    -2.8679e-12
Obtain the time of arrival between the second and fourth waypoint. Create timestamps to sample the trajectory.
t0 = traj.TimeOfArrival(2);
tf = traj.TimeOfArrival(4);
sampleTimes = linspace(t0,tf,1000);
Obtain the position, orientation, velocity, and acceleration information at the sampled timestamps using the lookupPose object function.
[pos,orient,vel,accel,~] = lookupPose(traj,sampleTimes);
Get the yaw angle from the orientation.
eulOrientation = quat2eul(orient);
yawAngle = eulOrientation(:,1);
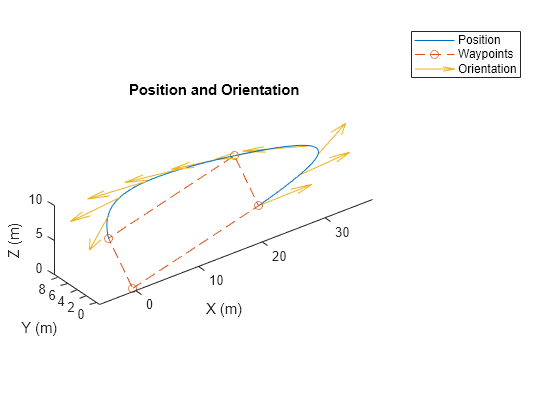
Plot the generated positions and orientations, as well as the specified waypoints.
plot3(pos(:,1),pos(:,2),pos(:,3), ...
      waypoints(1,:),waypoints(2,:),waypoints(3,:),"--o")
hold on
% Plot the yaw using quiver.
quiverIdx = 1:100:length(pos);
quiver3(pos(quiverIdx,1),pos(quiverIdx,2),pos(quiverIdx,3), ...
        cos(yawAngle(quiverIdx)),sin(yawAngle(quiverIdx)), ...
        zeros(numel(quiverIdx),1))
title("Position and Orientation")
xlabel("X (m)")
ylabel("Y (m)")
zlabel("Z (m)")
legend({"Position","Waypoints","Orientation"})
axis equal
hold off

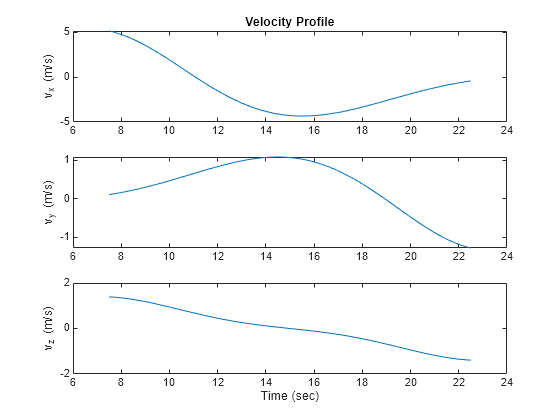
Plot the velocity profiles.
figure
subplot(3,1,1)
plot(sampleTimes,vel(:,1))
title("Velocity Profile")
ylabel("v_x (m/s)")
subplot(3,1,2)
plot(sampleTimes,vel(:,2))
ylabel("v_y (m/s)")
subplot(3,1,3)
plot(sampleTimes,vel(:,3))
ylabel("v_z (m/s)")
xlabel("Time (sec)")

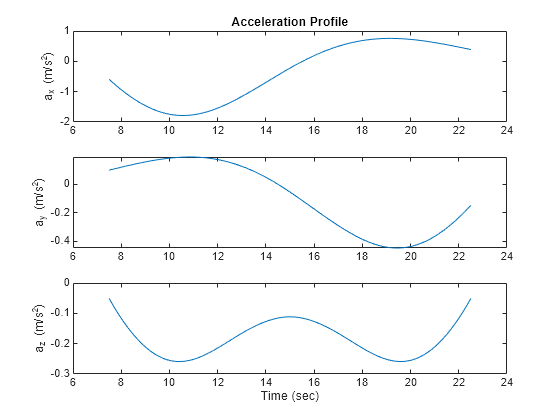
Plot the acceleration profiles.
figure
subplot(3,1,1)
plot(sampleTimes,accel(:,1))
title("Acceleration Profile")
ylabel("a_x (m/s^2)")
subplot(3,1,2)
plot(sampleTimes,accel(:,2))
ylabel("a_y (m/s^2)")
subplot(3,1,3)
plot(sampleTimes,accel(:,3))
ylabel("a_z (m/s^2)")
xlabel("Time (sec)")

Input Arguments
Polynomial trajectory, specified as a polynomialTrajectory
object.
Output Arguments
Trajectory information, returned as a table with variables corresponding to these properties of trajectory:
The trajectory information table always has columns for
Waypoints and TimeOfArrival. If you set the
Orientation property when constructing,the trajectory information
table additionally returns orientation.
Data Types: table
Version History
Introduced in R2023a
MATLAB Command
You clicked a link that corresponds to this MATLAB command:
Run the command by entering it in the MATLAB Command Window. Web browsers do not support MATLAB commands.
选择网站
选择网站以获取翻译的可用内容,以及查看当地活动和优惠。根据您的位置,我们建议您选择:。
您也可以从以下列表中选择网站:
如何获得最佳网站性能
选择中国网站(中文或英文)以获得最佳网站性能。其他 MathWorks 国家/地区网站并未针对您所在位置的访问进行优化。
美洲
- América Latina (Español)
- Canada (English)
- United States (English)
欧洲
- Belgium (English)
- Denmark (English)
- Deutschland (Deutsch)
- España (Español)
- Finland (English)
- France (Français)
- Ireland (English)
- Italia (Italiano)
- Luxembourg (English)
- Netherlands (English)
- Norway (English)
- Österreich (Deutsch)
- Portugal (English)
- Sweden (English)
- Switzerland
- United Kingdom (English)