Main Content

Access

Access analysis object belonging to scenario

Since R2021a

    Description

    The Access object defines an access analysis object belonging to a Satellite, GroundStation, ConicalSensor, or Platform object. Use this object to determine if the line-of-sight (LOS) between two objects exists.

    Also,

    For more information see, Algorithms.

    Creation

    You can create an Access object using the access object function of Satellite, GroundStation, ConicalSensor, or Platform.

    Properties

    expand all

    IDs of the satellites, ground stations, platforms, or conical sensors defining access analysis, specified as a vector of positive numbers.

    Visual width of access analysis object in pixels, specified as a scalar in the range (0, 10].

    The line width cannot be thinner than the width of a pixel. If you set the line width to a value that is less than the width of a pixel on your system, the line displays as one pixel wide.

    Color of access analysis line, specified as an RGB triplet, hexadecimal color code, a color name, or a short name.

    For a custom color, specify an RGB triplet or a hexadecimal color code.

    • An RGB triplet is a three-element row vector whose elements specify the intensities of the red, green, and blue components of the color. The intensities must be in the range [0,1], for example, [0.4 0.6 0.7].

    • A hexadecimal color code is a string scalar or character vector that starts with a hash symbol (#) followed by three or six hexadecimal digits, which can range from 0 to F. The values are not case sensitive. Therefore, the color codes "#FF8800", "#ff8800", "#F80", and "#f80" are equivalent.

    Alternatively, you can specify some common colors by name. This table lists the named color options, the equivalent RGB triplets, and hexadecimal color codes.

    Color NameShort NameRGB TripletHexadecimal Color CodeAppearance
    "red""r"[1 0 0]"#FF0000"

    Sample of the color red

    "green""g"[0 1 0]"#00FF00"

    Sample of the color green

    "blue""b"[0 0 1]"#0000FF"

    Sample of the color blue

    "cyan" "c"[0 1 1]"#00FFFF"

    Sample of the color cyan

    "magenta""m"[1 0 1]"#FF00FF"

    Sample of the color magenta

    "yellow""y"[1 1 0]"#FFFF00"

    Sample of the color yellow

    "black""k"[0 0 0]"#000000"

    Sample of the color black

    "white""w"[1 1 1]"#FFFFFF"

    Sample of the color white

    "none"Not applicableNot applicableNot applicableNo color

    Here are the RGB triplets and hexadecimal color codes for the default colors MATLAB® uses in many types of plots.

    RGB TripletHexadecimal Color CodeAppearance
    [0 0.4470 0.7410]"#0072BD"

    Sample of RGB triplet [0 0.4470 0.7410], which appears as dark blue

    [0.8500 0.3250 0.0980]"#D95319"

    Sample of RGB triplet [0.8500 0.3250 0.0980], which appears as dark orange

    [0.9290 0.6940 0.1250]"#EDB120"

    Sample of RGB triplet [0.9290 0.6940 0.1250], which appears as dark yellow

    [0.4940 0.1840 0.5560]"#7E2F8E"

    Sample of RGB triplet [0.4940 0.1840 0.5560], which appears as dark purple

    [0.4660 0.6740 0.1880]"#77AC30"

    Sample of RGB triplet [0.4660 0.6740 0.1880], which appears as medium green

    [0.3010 0.7450 0.9330]"#4DBEEE"

    Sample of RGB triplet [0.3010 0.7450 0.9330], which appears as light blue

    [0.6350 0.0780 0.1840]"#A2142F"

    Sample of RGB triplet [0.6350 0.0780 0.1840], which appears as dark red

    Example: 'blue'

    Example: [0 0 1]

    Example: '#0000FF'

    Object Functions

    showShow object in satellite scenario viewer
    accessStatusStatus of access between first and last node defining access analysis
    accessIntervalsIntervals during which access status is true
    accessPercentagePercentage of time when access exists between first and last node in access analysis
    hideHide satellite scenario entity from viewer

    Examples

    collapse all

    Create a satellite scenario and add ground stations from latitudes and longitudes.

    startTime = datetime(2020,5,1,11,36,0);
    stopTime = startTime + days(1);
    sampleTime = 60;
    sc = satelliteScenario(startTime,stopTime,sampleTime);
    lat = 10;
    lon = -30;
    gs = groundStation(sc,lat,lon);

    Add satellites using Keplerian elements.

    semiMajorAxis = 10000000;
    eccentricity = 0;
    inclination = 10; 
    rightAscensionOfAscendingNode = 0; 
    argumentOfPeriapsis = 0; 
    trueAnomaly = 0; 
    sat = satellite(sc,semiMajorAxis,eccentricity,inclination, ...
            rightAscensionOfAscendingNode,argumentOfPeriapsis,trueAnomaly);

    Add access analysis to the scenario and obtain the table of intervals of access between the satellite and the ground station.

    ac = access(sat,gs);
    intvls = accessIntervals(ac)
    intvls=8×8 table
           Source              Target          IntervalNumber         StartTime                EndTime           Duration    StartOrbit    EndOrbit
        _____________    __________________    ______________    ____________________    ____________________    ________    __________    ________
    
        "Satellite 2"    "Ground station 1"          1           01-May-2020 11:36:00    01-May-2020 12:04:00      1680          1            1    
        "Satellite 2"    "Ground station 1"          2           01-May-2020 14:20:00    01-May-2020 15:11:00      3060          1            2    
        "Satellite 2"    "Ground station 1"          3           01-May-2020 17:27:00    01-May-2020 18:18:00      3060          3            3    
        "Satellite 2"    "Ground station 1"          4           01-May-2020 20:34:00    01-May-2020 21:25:00      3060          4            4    
        "Satellite 2"    "Ground station 1"          5           01-May-2020 23:41:00    02-May-2020 00:31:00      3000          5            5    
        "Satellite 2"    "Ground station 1"          6           02-May-2020 02:50:00    02-May-2020 03:39:00      2940          6            6    
        "Satellite 2"    "Ground station 1"          7           02-May-2020 05:58:00    02-May-2020 06:47:00      2940          7            7    
        "Satellite 2"    "Ground station 1"          8           02-May-2020 09:06:00    02-May-2020 09:56:00      3000          8            9    


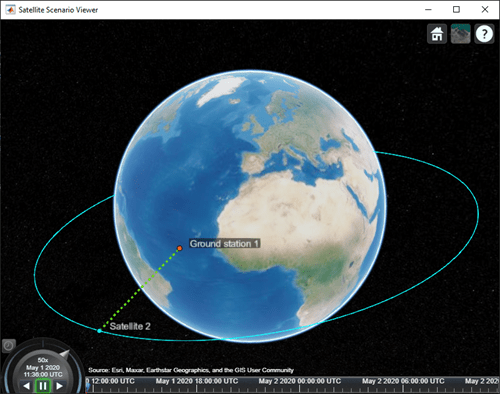
    Play the scenario to visualize the ground stations.

    play(sc)

    Create a satellite scenario.

    startTime = datetime(2020,5,1,11,36,0);
    stopTime = startTime + days(1);
    sampleTime = 60;
    sc = satelliteScenario(startTime,stopTime,sampleTime);
    lat = 10;
    lon = -30;

    Add a platform using the given trajectory in the satellite scenario.

    trajectory = geoTrajectory([40.6413,-73.7781,10600;32.3634,-64.7053,10600],[0,2*3600],AutoPitch=true,AutoBank=true);
    pltf = platform(sc,trajectory);

    Add a satellite using Keplerian elements.

    semiMajorAxis = 10000000;
    eccentricity = 0;
    inclination = 10; 
    rightAscensionOfAscendingNode = 0; 
    argumentOfPeriapsis = 0; 
    trueAnomaly = 0; 
    sat = satellite(sc,semiMajorAxis,eccentricity,inclination, ...
            rightAscensionOfAscendingNode,argumentOfPeriapsis,trueAnomaly);

    Add access analysis to the scenario and obtain the table of intervals of access between the satellite and the platform.

    ac = access(sat,pltf);
    intvls = accessIntervals(ac)
    intvls=7×8 table
           Source           Target       IntervalNumber         StartTime                EndTime           Duration    StartOrbit    EndOrbit
        _____________    ____________    ______________    ____________________    ____________________    ________    __________    ________
    
        "Satellite 2"    "Platform 1"          1           01-May-2020 14:07:00    01-May-2020 14:54:00      2820          1            2    
        "Satellite 2"    "Platform 1"          2           01-May-2020 17:11:00    01-May-2020 18:01:00      3000          3            3    
        "Satellite 2"    "Platform 1"          3           01-May-2020 20:16:00    01-May-2020 21:06:00      3000          4            4    
        "Satellite 2"    "Platform 1"          4           01-May-2020 23:22:00    02-May-2020 00:11:00      2940          5            5    
        "Satellite 2"    "Platform 1"          5           02-May-2020 02:31:00    02-May-2020 03:15:00      2640          6            6    
        "Satellite 2"    "Platform 1"          6           02-May-2020 05:43:00    02-May-2020 06:22:00      2340          7            7    
        "Satellite 2"    "Platform 1"          7           02-May-2020 08:54:00    02-May-2020 09:33:00      2340          8            8    


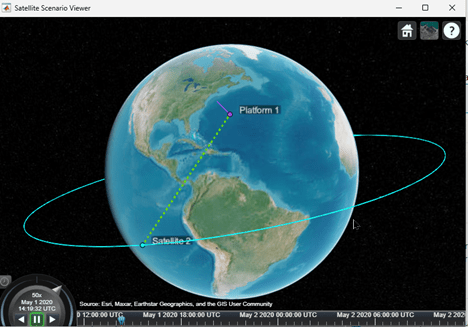
    Play the scenario to visualize the platform and the satellite.

    play(sc)

    platform_accessintervals_example.png

    Algorithms

    In order for access to exist:

    • Between two satellites, line of sight must exist between the two satellites.

    • Between a satellite and a ground station, line of sight must exist between the two. In addition, the elevation angle of the satellite and the ground station must be greater than the MinElevationAngle of the ground station.

    • Between two ground stations, line of sight must exist between the two and the elevation angle with respect to one another must be above the MinElevationAngle of the other.

    • Between a conical sensor not attached to the satellite, line of sight must exist between the conical sensor and the satellite and the satellite must be in the field of view of the conical sensor. The field of view is a region of cone whose vertex is at the conical sensor location and extends indefinitely along the z axis of the cone. The cone angle is defined by the MaxViewAngle of the conical sensor. In addition, if the conical sensor is attached to a ground station (directly or via a gimbal), the elevation angle of the satellite with respect to that ground station must be greater than or equal to each MinElevationAngle of the ground station. There is always access between the conical sensor and the satellite, if the conical sensor is attached to the same satellite

    • Between two conical sensors not attached to the same satellite, line of sight must exist between the two sensors, and each sensor must be inside the field of view of the other. If a conical sensor is attached to a ground station, the elevation angle of the other conical sensor with respect to the ground station must be greater than or equal to the MinElevationAngle. There is always access between two conical sensors, if the conical sensors are attached to the same satellite or ground station directly or via gimbals

    • Between a conical sensor not attached to a ground station, there must be line of sight between the two, the elevation angle of the conical sensor with respect to the ground station must be greater than or equal to its MinElevationAngle, and the ground station must be inside the field of view of the sensor. there is always access if the conical sensor is attached to this ground station directly or via a gimbal

    The above just described access between two nodes. However, you can have more than two nodes by chaining them, such as going from a ground station to a conical sensor on a satellite, then down to another ground station. In such a case, access must exist between each individual pair of adjacent nodes. For instance:

    sc = satelliteScenario;
    sat = satellite(sc,10000000,0,0,0,0,0);
    c = conicalSensor(sat);
    gs1 = groundStation(sc);
    gs2 = groundStation(sc,0,0);

    ac = access(gs1,c,gs2);
    s = accessStatus(ac,sc.StartTime)

    s will be true when there is access between gs1 and c, and c and gs2. Also, the following must be true at sc.StartTime:

    • Line of sight must exist between gs1 and c.

    • Elevation angle of c with respect to gs1 must be greater than or equal to MinElevationAngle of gs1.

    • gs1 must be inside the field of view of c.

    • Line of sight must exist between c and gs2.

    • Elevation angle of c with respect to gs2 must be greater than or equal to MinElevationAngle of gs2.

    • gs2 must be inside the field of view of c.

    For more information, see Satellite Constellation Access to Ground Station.

    Version History

    Introduced in R2021a