在 MATLAB 中执行
使用状态图设计逻辑,并将该逻辑作为 MATLAB 程序执行。在 Stateflow 编辑器中执行图并对其进行单元测试。用图来控制用户界面和数据处理应用程序的行为。
函数
Stateflow 语法
主题
- Create Stateflow Charts for Execution as MATLAB Objects
Save standalone Stateflow charts outside of Simulink® models.
- Execute and Unit Test Stateflow Chart Objects
Run Stateflow charts in MATLAB or through the Stateflow Editor.
- Execute Stateflow Chart Objects Through Scripts and Models
Create a MATLAB script or a Simulink model that invokes a standalone Stateflow chart.
- 将 MATLAB 代码转换为 Stateflow 流程图
根据您的 MATLAB 代码生成流程图。
疑难解答
Debug a Standalone Stateflow Chart
Interrupt execution to step through each action in a Stateflow chart.
精选示例
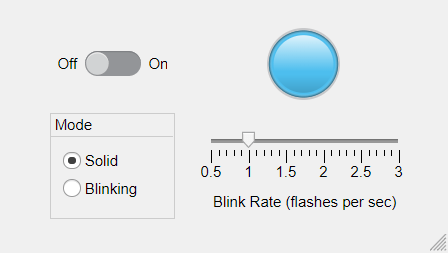
使用 Stateflow 图设计人机界面逻辑
在独立 Stateflow 图中对信号灯 App 的逻辑进行建模。

Model a Communications Protocol by Using Chart Objects
Use a standalone Stateflow® chart to model a frame-synchronization and symbol-detection component in a communications system. Standalone charts implement classic chart semantics with MATLAB® as the action language. You can program the chart by using the full functionality of MATLAB, including those functions that are restricted for code generation in Simulink®. For more information, see Create Stateflow Charts for Execution as MATLAB Objects.
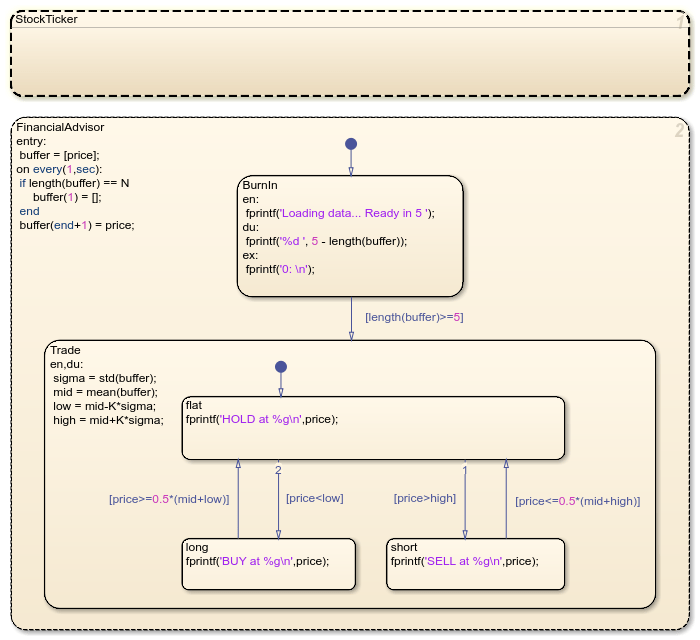
Implement a Financial Strategy by Using Stateflow
Use a standalone Stateflow® chart to model a financial trading strategy known as Bollinger Bands. Standalone charts implement classic chart semantics with MATLAB® as the action language. You can program the chart by using the full functionality of MATLAB, including those functions that are restricted for code generation in Simulink®. For more information, see Create Stateflow Charts for Execution as MATLAB Objects.
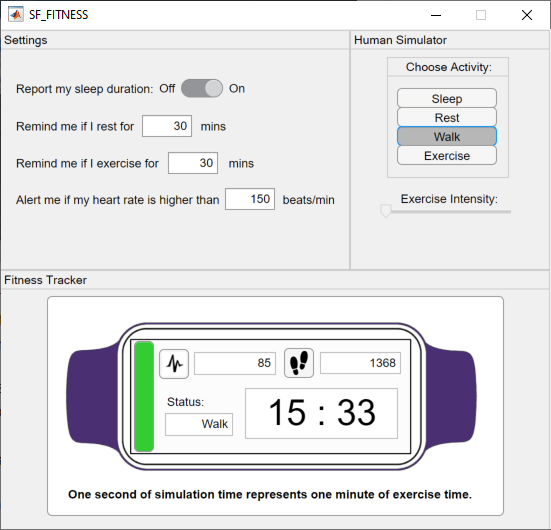
Model a Fitness App by Using Standalone Charts
Implement a fitness tracker by using multiple standalone charts and a MATLAB app.

Model Bluetooth Low Energy Link Layer Using Stateflow
Use a standalone Stateflow chart to model the state machine in a Bluetooth® low energy link layer.

使用 Stateflow 图自动控制智能车辆
使用由相同决策逻辑控制的智能车辆进行高速公路场景建模。

Analog Triggered Data Acquisition Using Stateflow Charts
Create an analog-triggered data acquisition app by using Stateflow, Data Acquisition Toolbox™, and App Designer.
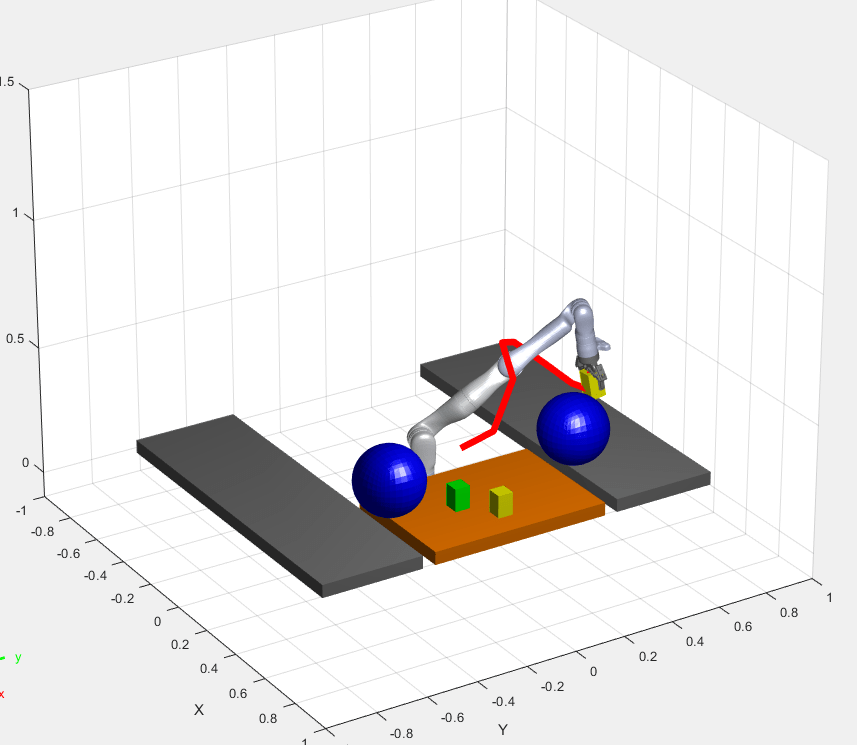
Pick-and-Place Workflow Using Stateflow for MATLAB
Design a pick-and-place workflow for a robotic manipulator such as Kinova® Gen3 using Stateflow.