DriftDiagnostics
Description
A DriftDiagnostics object stores the diagnostics information
returned by the detectdrift function after it performs permutation
testing for batch drift detection.
Creation
Create a DriftDiagnostics object by using detectdrift to test
for drift between baseline and target data sets.
Properties
Object Functions
ecdf | Compute empirical cumulative distribution function (ecdf) for baseline and target data specified for data drift detection |
histcounts | Compute histogram bin counts for specified variables in baseline and target data for drift detection |
plotDriftStatus | Plot p-values and confidence intervals for variables tested for data drift |
plotEmpiricalCDF | Plot empirical cumulative distribution function (ecdf) of a variable specified for data drift detection |
plotHistogram | Plot histogram of a variable specified for data drift detection |
plotPermutationResults | Plot histogram of permutation results for a variable specified for data drift detection |
summary | Summary table for DriftDiagnostics object |
Examples
Test and Examine Drift Status
Load the sample data.
load humanactivityFor details on the data set, enter Description at the command line.
Assign the first 250 observations as baseline data and the next 250 as target data for variables 1 to 15.
baseline = feat(1:250,1:15);
target = feat(251:500,1:15);
Test for drift on all variables.
DDiagnostics = detectdrift(baseline,target);
Display a summary of the test results.
summary(DDiagnostics)
    Multiple Test Correction Drift Status: Drift

           DriftStatus    PValue       ConfidenceInterval
           ___________    ______    ________________________

    x1      "Drift"       0.001     2.5317e-05     0.0055589
    x2      "Drift"       0.001     2.5317e-05     0.0055589
    x3      "Drift"       0.001     2.5317e-05     0.0055589
    x4      "Drift"       0.001     2.5317e-05     0.0055589
    x5      "Drift"       0.001     2.5317e-05     0.0055589
    x6      "Drift"       0.001     2.5317e-05     0.0055589
    x7      "Drift"       0.001     2.5317e-05     0.0055589
    x8      "Stable"      0.863        0.84012       0.88372
    x9      "Stable"      0.726        0.69722       0.75344
    x10     "Drift"       0.001     2.5317e-05     0.0055589
    x11     "Stable"      0.496        0.46456       0.52746
    x12     "Stable"      0.249        0.22247       0.27702
    x13     "Drift"       0.001     2.5317e-05     0.0055589
    x14     "Stable"      0.574        0.54267       0.60489
    x15     "Warning"     0.094       0.076629        0.1138
The summary table shows the drift status and estimated p-value for each variable tested for drift detection. You can also see the 95% confidence interval bounds for the p-values.
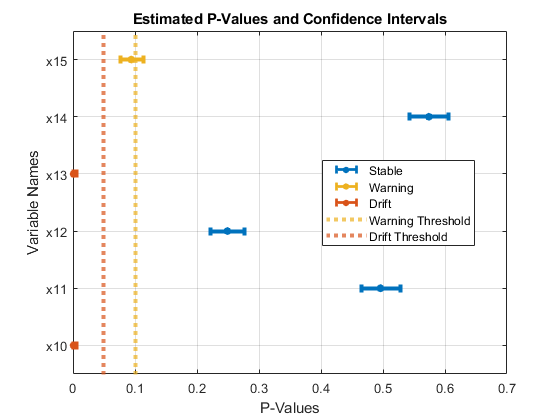
Plot drift status for variables x10 to x15.
plotDriftStatus(DDiagnostics,Variables=(10:15))
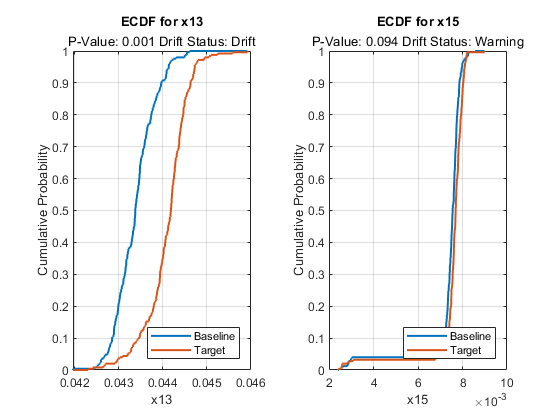
Compute the ecdf values for variables x13 and x15.
E = ecdf(DDiagnostics,Variables=["x13","x15"])
E=2×3 table
                 x             F_Baseline         F_Target
           ______________    ______________    ______________

    x13    {501×1 double}    {501×1 double}    {501×1 double}
    x15    {501×1 double}    {501×1 double}    {501×1 double}
x contains the common domain over which ecdf computes the empirical cumulative distribution function for the baseline and target data of a variable. Access the common domain for x13.
E.x{1}ans = 501×1
0.0420
0.0420
0.0423
0.0424
0.0424
0.0425
0.0425
0.0426
0.0426
0.0426
⋮
Access the ecdf values for x15 in the baseline data.
E.F_Baseline{2}ans = 501×1
0
0
0.0040
0.0080
0.0080
0.0080
0.0080
0.0080
0.0120
0.0120
⋮
Plot the ecdf values for variables x13 and x15.
tiledlayout(1,2)
ax1 = nexttile;
plotEmpiricalCDF(DDiagnostics,ax1,Variable="x13")
ax2= nexttile;
plotEmpiricalCDF(DDiagnostics,ax2,Variable="x15")
You can also visualize the permutation test results for a variable. Plot the permutation results for variable x13.
figure
plotPermutationResults(DDiagnostics,Variable="x13")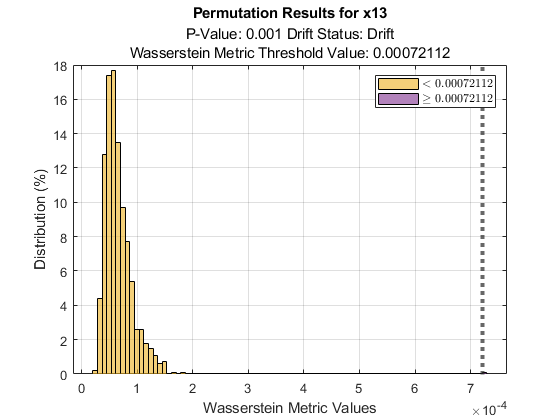
The plot also shows the metric threshold value with a straight line. Based on the histogram of metric values obtained during permutation testing, the probability that a metric value being greater than the threshold value if the baseline and target data for variable x13 have the same distribution is very small. The plot also displays the estimated p-value, 0.001, and the drift status, Drift, below the plot title.
Compute Metrics Without Estimating p-Values
Generate baseline and target data with three variables, where the distribution parameters of the second and third variables change for the target data.
rng('default') % For reproducibility
baseline = [normrnd(0,1,100,1),wblrnd(1.1,1,100,1),betarnd(1,2,100,1)];
target = [normrnd(0,1,100,1),wblrnd(1.2,2,100,1),betarnd(1.7,2.8,100,1)];
Compute the initial metrics for all variables between the baseline and target data without estimating the p-values.
DDiagnostics = detectdrift(baseline,target,EstimatePValues=false)
DDiagnostics =
  DriftDiagnostics

           VariableNames: ["x1"    "x2"    "x3"]
    CategoricalVariables: []
                 Metrics: ["Wasserstein"    "Wasserstein"    "Wasserstein"]
            MetricValues: [0.2022 0.3468 0.0559]


  Properties, Methods
detectdrift computes only the initial metric value for each variable using the baseline and target data. The properties associated with permutation testing and p-value estimation are either empty or contain NaNs.
summary(DDiagnostics)
          MetricValue       Metric
          ___________    _____________

    x1      0.20215      "Wasserstein"
    x2      0.34676      "Wasserstein"
    x3     0.055922      "Wasserstein"
summary function displays only the initial metric value and the metric used for each specified variable.
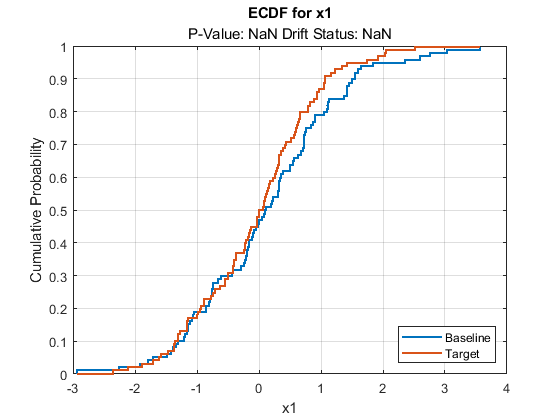
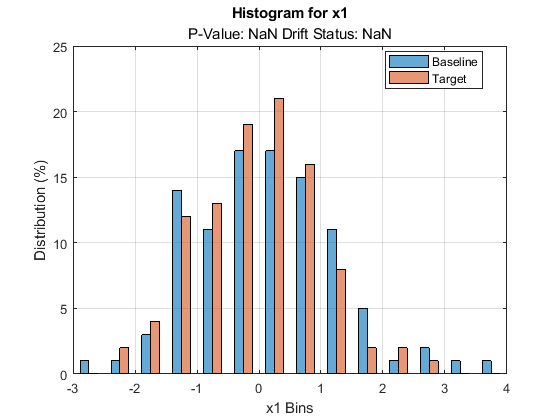
plotDriftStatus and plotPermutationResults do not produce plots and return warning messages when you compute metrics without estimating p-values. plotEmpiricalCDF and plotHistogram plot the ecdf and the histogram, respectively, for the first variable by default. They both return NaN for the p-value and drift status associated with the variable.
plotEmpiricalCDF(DDiagnostics)
plotHistogram(DDiagnostics)
Version History
Introduced in R2022a
See Also
detectdrift | ecdf | histcounts | plotDriftStatus | plotEmpiricalCDF | plotHistogram | plotPermutationResults | summary
You can also select a web site from the following list:
Americas
- América Latina (Español)
- Canada (English)
- United States (English)
Europe
- Belgium (English)
- Denmark (English)
- Deutschland (Deutsch)
- España (Español)
- Finland (English)
- France (Français)
- Ireland (English)
- Italia (Italiano)
- Luxembourg (English)
- Netherlands (English)
- Norway (English)
- Österreich (Deutsch)
- Portugal (English)
- Sweden (English)
- Switzerland
- United Kingdom (English)