Reduce Dimensionality
Reduce dimensionality using Principal Component Analysis (PCA) in Live Editor
Since R2022b
Description
The Reduce Dimensionality Live Editor task enables you to interactively perform Principal Component Analysis (PCA). The task generates MATLAB® code for your live script and returns the resulting transformed data to the MATLAB workspace.
Using the Reduce Dimensionality Live Editor task, you can:
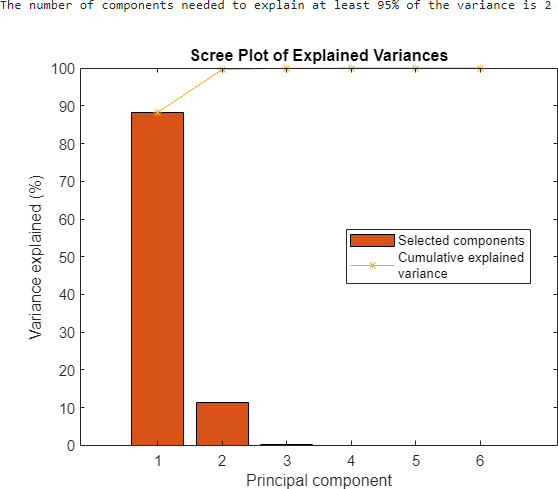
Determine the number of components required to explain the variance of a fixed percentage of the data, such as 95% or 99%.
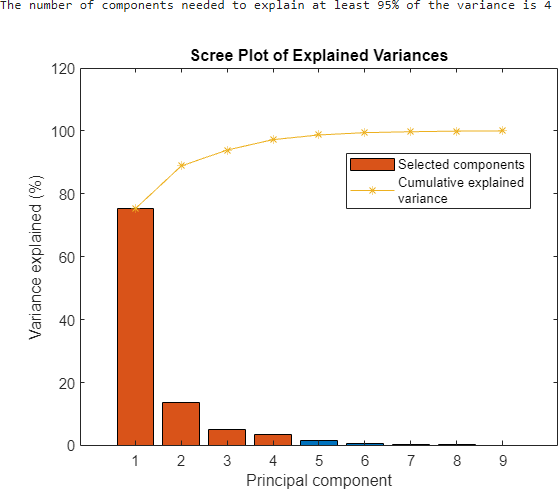
Create a scree plot of explained variances of the principal components.
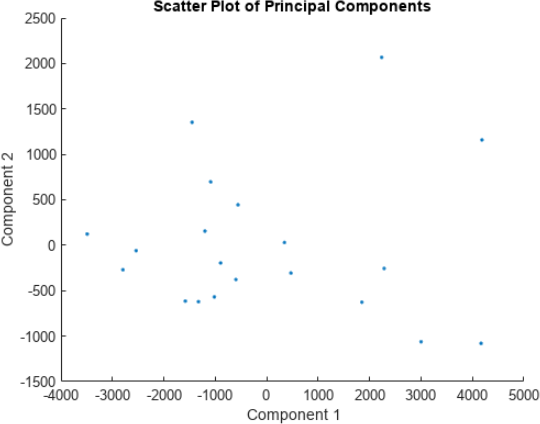
Create a scatter plot of two principal components.
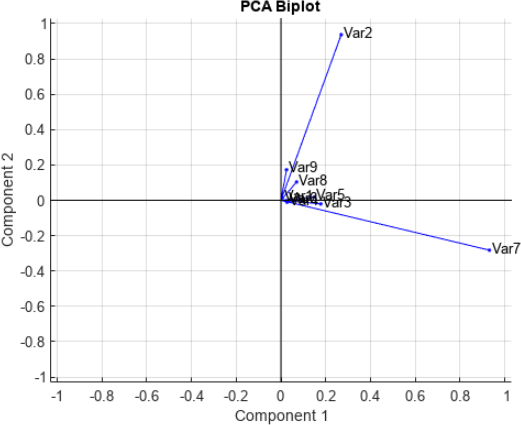
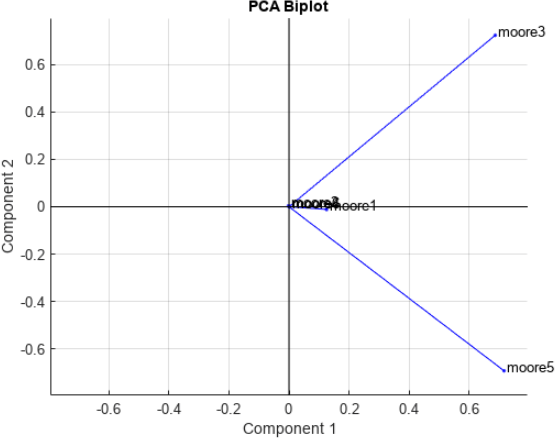
Create a biplot of two principal components.
Obtain the transformed data.
For general information about Live Editor tasks, see Add Interactive Tasks to a Live Script.
Open the Task
To add the Reduce Dimensionality task to a live script, perform one of these actions:
On the Live Editor tab, select Task > Reduce Dimensionality; or on the Insert tab, select Task > Reduce Dimensionality.
In a code block in the live script, type a relevant keyword, such as
pcaorreduce. Select Reduce Dimensionality from the suggested command completions.
Examples
Load the cities data set.
load citiesIn the File section of the Home tab, click New Live Script.
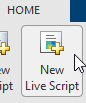
In the Code section of the Live Editor tab, click Task to open the task gallery. Under Statistics and Machine Learning, click Reduce Dimensionality.
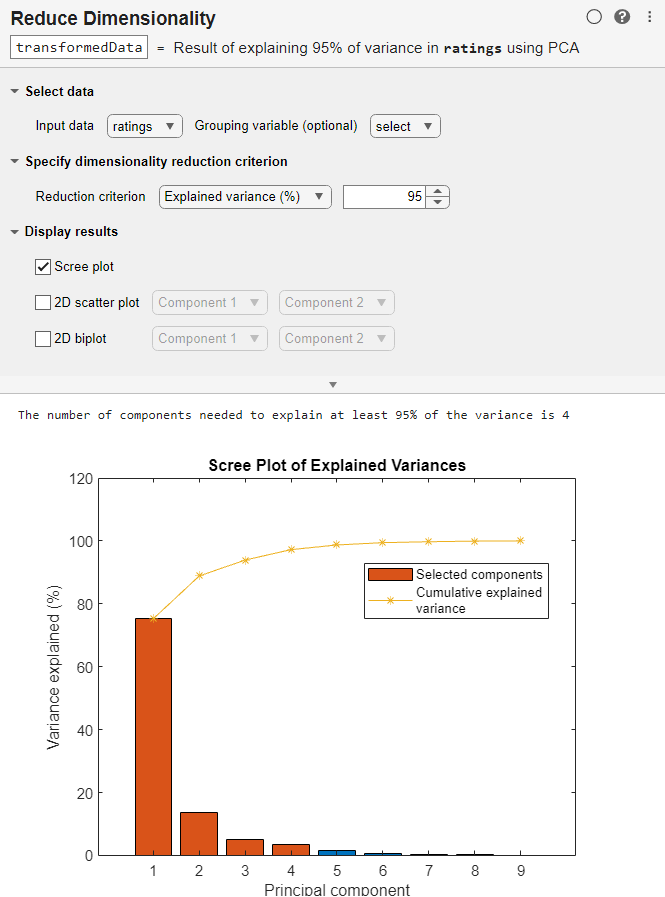
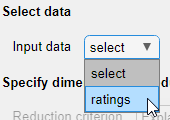
Select Input data > ratings.
Run the task by the diagonal striped bar on the left of the Live Editor window, or by pressing Ctrl+Enter. By default, the task creates three plots.

The software returns the transformed data to the workspace as a variable named
transformedData (by default). You can edit this name.

Load the moore data set.
load mooreConvert the data into a table.
tbl = array2table(moore);
In the File section of the Home tab, click New Live Script.
In the Code section of the Live Editor tab, click Task to open the task gallery. Under Statistics and Machine Learning, click Reduce Dimensionality.
Select Input data > tbl.

Run the task by clicking the diagonal striped bar on the left of the Live Editor window, or by pressing Ctrl+Enter. By default, the task creates three plots.
Related Examples
Parameters
Tips
By default, the Reduce Dimensionality task does not run automatically when you modify the task parameters. To have the task run automatically after any change, select the Autorun
 button at the top right of the task. If your data set is
large, enabling this option can cause the task to run slowly.
button at the top right of the task. If your data set is
large, enabling this option can cause the task to run slowly.
Version History
Introduced in R2022b