降维和特征提取
特征转换方法可以通过将数据转换为新特征来减少数据的维度。当无法转换变量时(例如,当数据中存在分类变量时),最好使用特征选择方法。有关特别适用于最小二乘拟合的特征选择方法,请参阅逐步回归。
实时编辑器任务
| 降低维度 | Reduce dimensionality using Principal Component Analysis (PCA) in Live Editor (自 R2022b 起) |
函数
对象
主题
特征选择
- Introduction to Feature Selection
Learn about feature selection algorithms and explore the functions available for feature selection. - Sequential Feature Selection
This topic introduces sequential feature selection and provides an example that selects features sequentially using a custom criterion and thesequentialfsfunction. - Neighborhood Component Analysis (NCA) Feature Selection
Neighborhood component analysis (NCA) is a non-parametric method for selecting features with the goal of maximizing prediction accuracy of regression and classification algorithms.
- Regularize Discriminant Analysis Classifier
Make a more robust and simpler model by removing predictors without compromising the predictive power of the model. - Select Predictors for Random Forests
Select split-predictors for random forests using interaction test algorithm.
特征提取
- Feature Extraction
Feature extraction is a set of methods to extract high-level features from data. - Feature Extraction Workflow
This example shows a complete workflow for feature extraction from image data. - Extract Mixed Signals
This example shows how to usericato disentangle mixed audio signals.
t-SNE 多维可视化
- t-SNE
t-SNE is a method for visualizing high-dimensional data by nonlinear reduction to two or three dimensions, while preserving some features of the original data. - Visualize High-Dimensional Data Using t-SNE
This example shows how t-SNE creates a useful low-dimensional embedding of high-dimensional data. - Modify t-SNE Settings
This example shows the effects of varioustsnesettings. - t-SNE Output Function
Output function description and example for t-SNE.
PCA 和典型相关
- 主成分分析 (PCA)
主成分分析通过用一组新变量替换几个相关变量来降低数据的维数,这些新变量是原始变量的线性组合。 - Analyze and Model Data on GPU
Accelerate your code by using GPU array input arguments. - Analyze Quality of Life in US Cities Using PCA
Perform a weighted principal components analysis and interpret the results.
因子分析
- Factor Analysis
Factor analysis is a way to fit a model to multivariate data to estimate interdependence of measured variables on a smaller number of unobserved (latent) factors. - Analyze Stock Prices Using Factor Analysis
Use factor analysis to investigate whether companies within the same sector experience similar week-to-week changes in stock prices. - Perform Factor Analysis on Exam Grades
This example shows how to perform factor analysis using Statistics and Machine Learning Toolbox™.
非负矩阵分解
- Nonnegative Matrix Factorization
Nonnegative matrix factorization (NMF) is a dimension-reduction technique based on a low-rank approximation of the feature space. - Perform Nonnegative Matrix Factorization
Perform nonnegative matrix factorization using the multiplicative and alternating least-squares algorithms.
多维尺度分析
- Multidimensional Scaling
Multidimensional scaling allows you to visualize how near points are to each other for many kinds of distance or dissimilarity metrics and can produce a representation of data in a small number of dimensions. - Classical Multidimensional Scaling
Usecmdscaleto perform classical (metric) multidimensional scaling, also known as principal coordinates analysis. - Classical Multidimensional Scaling Applied to Nonspatial Distances
This example shows how to perform classical multidimensional scaling using thecmdscalefunction in Statistics and Machine Learning Toolbox™. - Nonclassical Multidimensional Scaling
This example shows how to visualize dissimilarity data using nonclassical forms of multidimensional scaling (MDS). - Nonclassical and Nonmetric Multidimensional Scaling
Perform nonclassical multidimensional scaling usingmdscale.
普氏分析
- Compare Handwritten Shapes Using Procrustes Analysis
Use Procrustes analysis to compare two handwritten numerals.
精选示例
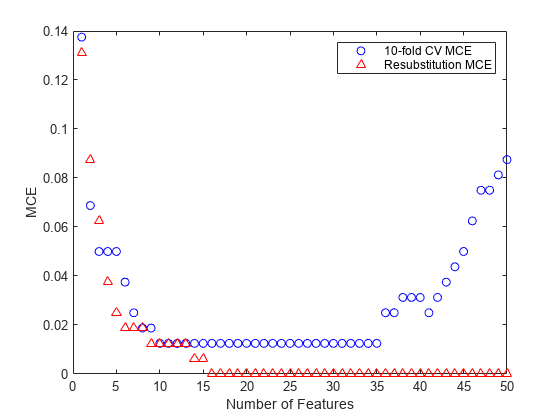
选择用于高维数据分类的特征
此示例说明如何选择用于高维数据分类的特征。具体而言,示例说明如何执行序列特征选择,这是最常用的特征选择算法之一。示例还说明如何使用留出法和交叉验证来评估所选特征的分类性能。

偏最小二乘回归和主成分回归
应用偏最小二乘回归 (PLSR) 和主成分回归 (PCR),并研究这两种方法的有效性。
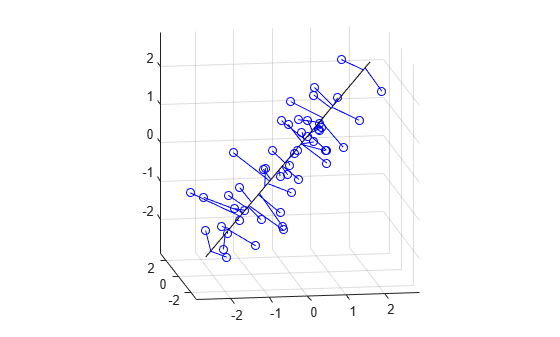
Fitting an Orthogonal Regression Using Principal Components Analysis
Use Principal Components Analysis (PCA) to fit a linear regression. PCA minimizes the perpendicular distances from the data to the fitted model. This is the linear case of what is known variously as Orthogonal Regression, Total Least Squares, Deming Regression, or Errors-in-variables, and is appropriate when there is no natural distinction between predictor and response variables, or when all variables are measured with error. This is in contrast to the usual regression assumption that predictor variables are measured exactly, and only the response variable has an error component.