mahal
到参考样本的马氏距离
说明
示例
生成相关的二元样本数据集。
rng('default') % For reproducibility
X = mvnrnd([0;0],[1 .9;.9 1],1000);
指定四个在欧几里德距离上到 X 的均值等距的观测值。
Y = [1 1;1 -1;-1 1;-1 -1];
计算 Y 中每个观测值到 X 中参考样本的马氏距离。
d2_mahal = mahal(Y,X)
d2_mahal = 4×1

    1.1095
   20.3632
   19.5939
    1.0137
计算 Y 中每个观测值到 X 均值的平方欧几里德距离。
d2_Euclidean = sum((Y-mean(X)).^2,2)
d2_Euclidean = 4×1

    2.0931
    2.0399
    1.9625
    1.9094
使用 scatter 绘制 X 和 Y,并使用标记颜色来可视化 Y 到 X 中参考样本的马氏距离。
scatter(X(:,1),X(:,2),10,'.') % Scatter plot with points of size 10
hold on
scatter(Y(:,1),Y(:,2),100,d2_mahal,'o','filled')
hb = colorbar;
ylabel(hb,'Mahalanobis Distance')
legend('X','Y','Location','best')
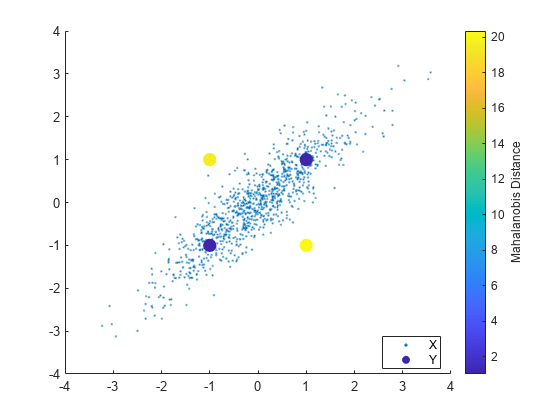
Y 中的所有观测值([1,1]、[-1,-1,]、[1,-1] 和 [-1,1])在欧几里德距离上与 X 均值等距。但在马氏距离上,[1,1] 和 [-1,-1] 比 [1,-1] 和 [-1,1] 更接近 X。由于马氏距离会考虑数据的协方差和不同变量的尺度,因此它对于检测离群值非常有用。
输入参数
输出参量
详细信息
提示
版本历史记录
在 R2006a 之前推出