RobustRandomCutForest
Description
Use a robust random cut forest model object
RobustRandomCutForest for outlier detection and novelty
detection.
Outlier detection (detecting anomalies in training data) — Detect anomalies in training data by using the
rrcforestfunction. Therrcforestfunction returns aRobustRandomCutForestmodel object, anomaly indicators, and scores for the training data.Novelty detection (detecting anomalies in new data with uncontaminated training data) — Create a
RobustRandomCutForestmodel object by passing uncontaminated training data (data with no outliers) torrcforest. Detect anomalies in new data by passing the object and the new data to the object functionisanomaly. Theisanomalyfunction returns anomaly indicators and scores for the new data.
Creation
Create a RobustRandomCutForest model object by using the rrcforest
function.
Properties
Object Functions
isanomaly | Find anomalies in data using robust random cut forest |
incrementalLearner | Convert robust random cut forest model to incremental learner |
Examples
Detect outliers (anomalies in training data) by using the rrcforest function.
Load the sample data set NYCHousing2015.
load NYCHousing2015The data set includes 10 variables with information on the sales of properties in New York City in 2015. Display a summary of the data set.
summary(NYCHousing2015)
NYCHousing2015: 91446×10 table

Variables:

    BOROUGH: double
    NEIGHBORHOOD: cell array of character vectors
    BUILDINGCLASSCATEGORY: cell array of character vectors
    RESIDENTIALUNITS: double
    COMMERCIALUNITS: double
    LANDSQUAREFEET: double
    GROSSSQUAREFEET: double
    YEARBUILT: double
    SALEPRICE: double
    SALEDATE: datetime

Statistics for applicable variables:

                             NumMissing          Min              Median               Max               Mean               Std

    BOROUGH                      0                     1                  3                  5             2.8431            1.3343
    NEIGHBORHOOD                 0
    BUILDINGCLASSCATEGORY        0
    RESIDENTIALUNITS             0                     0                  1               8759             2.1789           32.2738
    COMMERCIALUNITS              0                     0                  0                612             0.2201            3.2991
    LANDSQUAREFEET               0                     0               1700           29305534         2.8752e+03        1.0118e+05
    GROSSSQUAREFEET              0                     0               1056            8942176         4.6598e+03        4.3098e+04
    YEARBUILT                    0                     0               1939               2016         1.7951e+03          526.9998
    SALEPRICE                    0                     0             333333         4.1111e+09         1.2364e+06        2.0130e+07
    SALEDATE                     0           01-Jan-2015        09-Jul-2015        31-Dec-2015        07-Jul-2015        2470:47:17
The SALEDATE column is a datetime array, which is not supported by rrcforest. Create columns for the month and day numbers of the datetime values, and then delete the SALEDATE column.
[~,NYCHousing2015.MM,NYCHousing2015.DD] = ymd(NYCHousing2015.SALEDATE);
NYCHousing2015.SALEDATE = [];
The columns BOROUGH, NEIGHBORHOOD, and BUILDINGCLASSCATEGORY contain categorical predictors. Display the number of categories for the categorical predictors.
length(unique(NYCHousing2015.BOROUGH))
ans =
5
length(unique(NYCHousing2015.NEIGHBORHOOD))
ans =
254
length(unique(NYCHousing2015.BUILDINGCLASSCATEGORY))
ans =
48
For a categorical variable with more than 64 categories, the rrcforest function uses an approximate splitting method that can reduce the accuracy of the robust random cut forest model. Remove the NEIGHBORHOOD column, which contains a categorical variable with 254 categories.
NYCHousing2015.NEIGHBORHOOD = [];
Train a robust random cut forest model for NYCHousing2015. Specify the fraction of anomalies in the training observations as 0.1, and specify the first variable (BOROUGH) as a categorical predictor. The first variable is a numeric array, so rrcforest assumes it is a continuous variable unless you specify the variable as a categorical variable.
rng("default") % For reproducibility
[Mdl,tf,scores] = rrcforest(NYCHousing2015, ...
    ContaminationFraction=0.1,CategoricalPredictors=1);
Mdl is a RobustRandomCutForest model object. rrcforest also returns the anomaly indicators (tf) and anomaly scores (scores) for the training data NYCHousing2015.
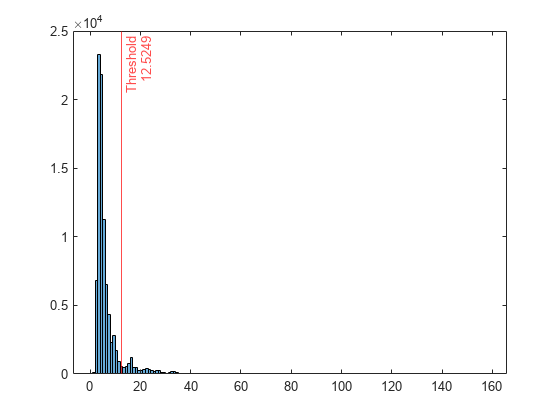
Plot a histogram of the score values. Create a vertical line at the score threshold corresponding to the specified fraction.
histogram(scores)
xline(Mdl.ScoreThreshold,"r-",["Threshold" Mdl.ScoreThreshold])
If you want to identify anomalies with a different contamination fraction (for example, 0.01), you can train a new robust random cut forest model.
rng("default") % For reproducibility
[newMdl,newtf,scores] = rrcforest(NYCHousing2015, ...
    ContaminationFraction=0.01,CategoricalPredictors=1);
If you want to identify anomalies with a different score threshold value (for example, 65), you can pass the RobustRandomCutForest model object, the training data, and a new threshold value to the isanomaly function.
[newtf,scores] = isanomaly(Mdl,NYCHousing2015,ScoreThreshold=65);
Note that changing the contamination fraction or score threshold changes the anomaly indicators only, and does not affect the anomaly scores. Therefore, if you do not want to compute the anomaly scores again by using rrcforest or isanomaly, you can obtain a new anomaly indicator using the existing score values.
Change the fraction of anomalies in the training data to 0.01.
newContaminationFraction = 0.01;
Find a new score threshold by using the quantile function.
newScoreThreshold = quantile(scores,1-newContaminationFraction)
newScoreThreshold =
63.2642
Obtain a new anomaly indicator.
newtf = scores > newScoreThreshold;
Create a RobustRandomCutForest model object for uncontaminated training observations by using the rrcforest function. Then detect novelties (anomalies in new data) by passing the object and the new data to the object function isanomaly.
Load the 1994 census data stored in census1994.mat. The data set contains demographic data from the US Census Bureau to predict whether an individual makes over $50,000 per year.
load census1994census1994 contains the training data set adultdata and the test data set adulttest.
Assume that adultdata does not contain outliers. Train a robust random cut forest model for adultdata. Specify StandardizeData as true to standardize the input data.
rng("default") % For reproducibility
[Mdl,tf,s] = rrcforest(adultdata,StandardizeData=true);
Mdl is a RobustRandomCutForest model object. rrcforest also returns the anomaly indicators tf and anomaly scores s for the training data adultdata. If you do not specify the ContaminationFraction name-value argument as a value greater than 0, then rrcforest treats all training observations as normal observations, meaning all the values in tf are logical 0 (false). The function sets the score threshold to the maximum score value. Display the threshold value.
Mdl.ScoreThreshold
ans =
86.5315
Find anomalies in adulttest by using the trained robust random cut forest model. Because you specified StandardizeData=true when you trained the model, the isanomaly function standardizes the input data by using the predictor means and standard deviations of the training data stored in the Mu and Sigma properties, respectively.
[tf_test,s_test] = isanomaly(Mdl,adulttest);
The isanomaly function returns the anomaly indicators tf_test and scores s_test for adulttest. By default, isanomaly identifies observations with scores above the threshold (Mdl.ScoreThreshold) as anomalies.
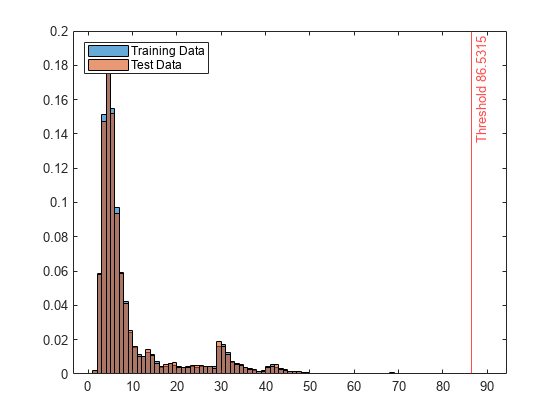
Create histograms for the anomaly scores s and s_test. Create a vertical line at the threshold of the anomaly scores.
histogram(s,Normalization="probability")
hold on
histogram(s_test,Normalization="probability")
xline(Mdl.ScoreThreshold,"r-",join(["Threshold" Mdl.ScoreThreshold]))
legend("Training Data","Test Data",Location="northwest")
hold off
Display the observation index of the anomalies in the test data.
find(tf_test)
ans =
3541
The anomaly score distribution of the test data is similar to that of the training data, so isanomaly detects a small number of anomalies in the test data with the default threshold value.
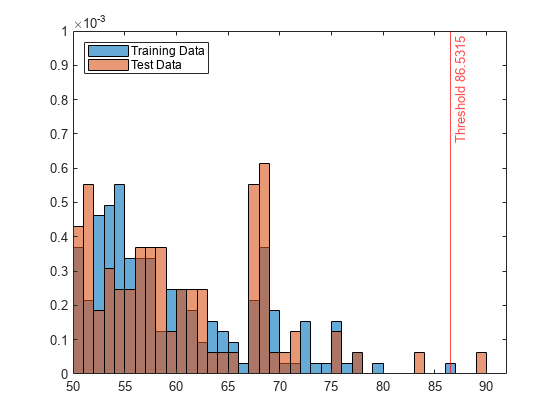
Zoom in to see the anomaly and the observations near the threshold.
xlim([50 92])
ylim([0 0.001])
You can specify a different threshold value by using the ScoreThreshold name-value argument. For an example, see Specify Anomaly Score Threshold.
More About
Tips
You can use interpretability features, such as
lime,shapley,partialDependence, andplotPartialDependence, to interpret how predictors contribute to anomaly scores. Define a custom function that returns anomaly scores, and then pass the custom function to the interpretability functions. For an example, see Specify Model Using Function Handle.
References
[1] Guha, Sudipto, N. Mishra, G. Roy, and O. Schrijvers. "Robust Random Cut Forest Based Anomaly Detection on Streams," Proceedings of The 33rd International Conference on Machine Learning 48 (June 2016): 2712–21.
[2] Bartos, Matthew D., A. Mullapudi, and S. C. Troutman. "rrcf: Implementation of the Robust Random Cut Forest Algorithm for Anomaly Detection on Streams." Journal of Open Source Software 4, no. 35 (2019): 1336.
Version History
Introduced in R2023a