Summary of Profiling Techniques
Analyze Profiling Methods
Code execution profiling is essential for optimizing and verifying the real-time performance of your algorithms. The following workflow outlines the steps to effectively use code execution profiling with a Simulink® model:
Design and Optimize Algorithm: Use your Simulink model to design and refine your algorithm.
Detect Overruns: Perform overrun detection to ensure tasks do not exceed their time limits. For more information, see Detect and Fix Task Overruns on Texas Instruments C2000 Hardware.
Execute on Target Hardware:
Perform processor-in-the-loop (PIL) based profiling to test the algorithm in a simulated hardware environment.
Run an XCP-based external mode simulation on your development computer or custom hardware to monitor real-time performance.
Use Hardware Profiler block for precise profiling.
Configure for Profiling: Set up the model for code execution profiling. For more information, see Code Execution Profiling on Texas Instruments C2000.
Analyze Execution Speed: Use profiling plots and reports to verify that the algorithm meets real-time execution requirements.
If the algorithm meets the requirements, consider enhancing it to utilize available processing power.
If the algorithm does not meet the requirements, identify ways to reduce execution time and pinpoint tasks that take the most time to explore possible trade-offs between functionality and speed.
For multicore processors, distribute the algorithm execution across available cores.
By following this workflow, you can ensure that your algorithm is optimized for real-time deployment and makes efficient use of available hardware resources.
Comparison of Profiling Techniques
Compare different profiling techniques and select appropriate profiling technique based on your specific requirements and hardware capabilities.
The table below compares different profiling techniques, highlighting their prerequisites, advantages, disadvantages, and target applications.
| Profiling Technique | Prerequisite | Advantage | Disadvantage | Target Application | Reference |
|---|---|---|---|---|---|
| PIL |
|
| Accurately measuring execution time before full-fledged hardware run | Code Execution Profiling on Texas Instruments C2000 | |
| Monitor and Tune |
|
| Monitor task overruns and other data for the entire model and throughout the execution duration. | Code Execution Profiling on Texas Instruments C2000 | |
| Debugger based profiling (Build, Load, and Run) |
|
| Monitor task overruns and other data for high-speed models across the entire system. | Code Execution Profiling on Texas Instruments C2000 | |
| Hardware Profiler (ERAD and Timer) | The target must support ERAD | Low overhead, Real-time logging | The model needs modification, a detailed report is not generated, and task preemption cannot be observed. | Accurate real-time execution profiling for small blocks or selected subsystem | Hardware Profiler |
| Hardware Profiler (GPIO) | Digital Storage Oscilloscope (DSO) is required | Low overhead, Real-time logging | The model needs modification, a detailed report is not generated, and task preemption cannot be observed. | Accurate real-time execution profiling for small blocks or selected subsystem | Hardware Profiler |
Monitor & tune and debugger-based profilers introduce significant overhead and should be used for analyzing larger subsystems and understanding task preemption.
PIL introduces moderate overhead and should not be used to profile very small subsystems or simple blocks.
Use a hardware profiler to profile small subsystems or blocks to get accurate data on execution time with very low overhead.
Using a subsystem or block in a loop, measuring the execution time of the loop, and then dividing the execution time by the loop count will provide more accurate profiling data and reduce the impact of measurement overhead.
Comparison of Profiling Overhead for Different Techniques
In this task, we compare the profiling overhead results for various techniques like Hardware profiling (ERAD, GPIO, Timer), Debugger based, Monitor & Tune, and PIL profiling. We profiled the following Simulink model and observed the comparison results.
open_system('gettingstartedwithhardwareprofiler.slx')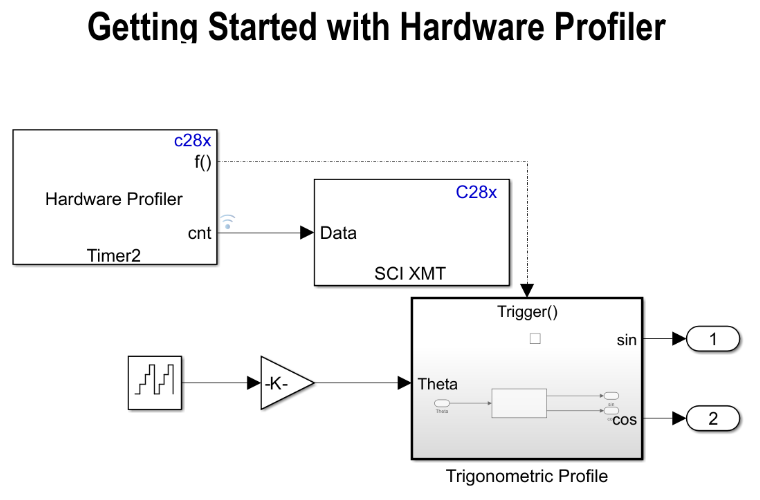
Hardware Profiler
Open the open_system('gettingstartedwithhardwareprofiler.slx')
model and profile the Trignometric Profile subsystem of the
model.
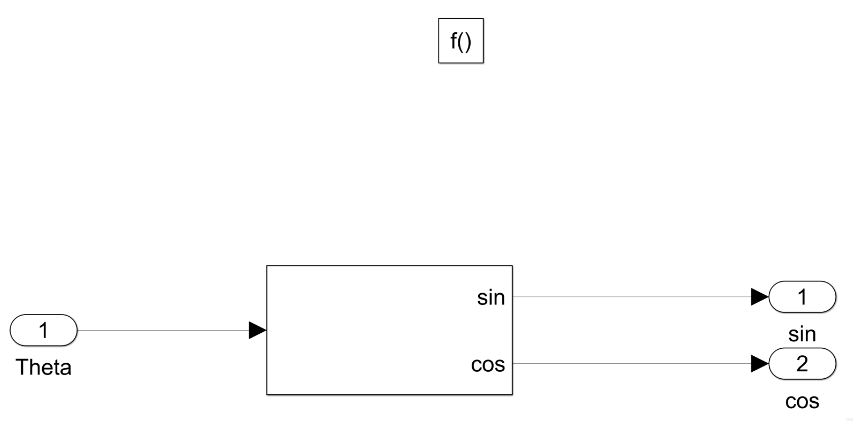
ERAD profiling. Observe the ERAD results in Simulation Data Inspector (SDI).
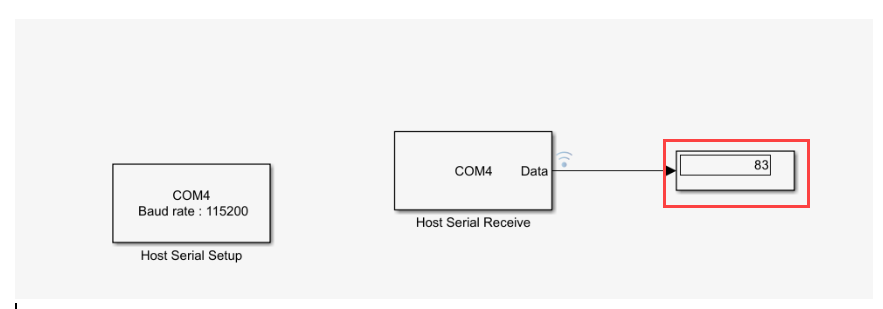
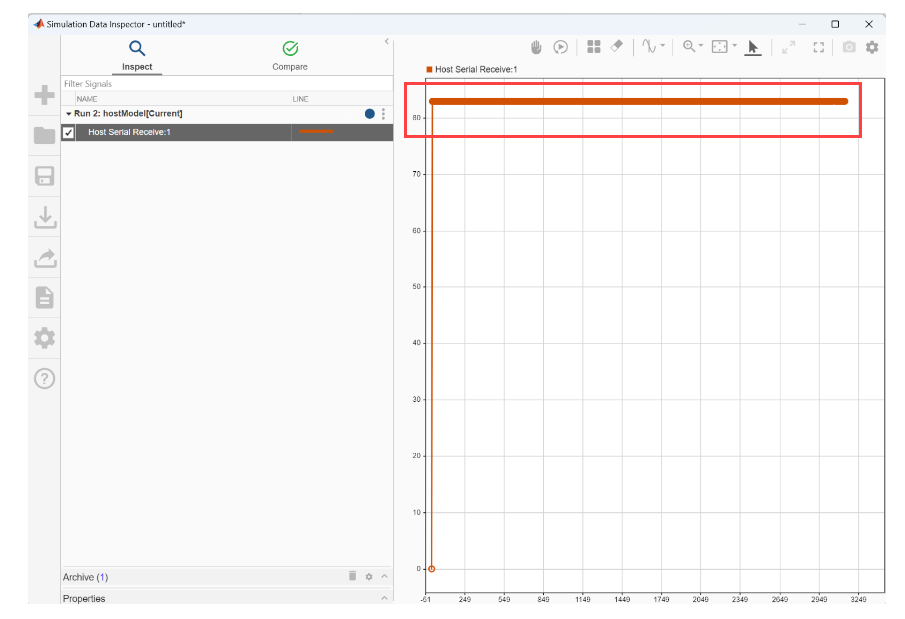
Timer Profiling. Observe the ERAD results in Simulation Data Inspector (SDI) or Display block.
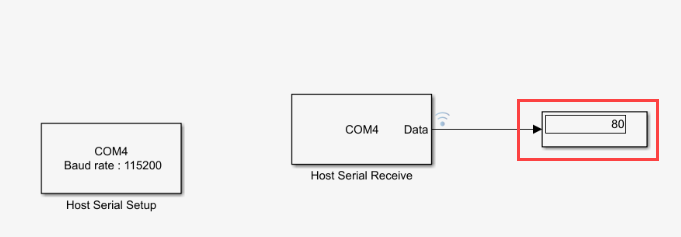
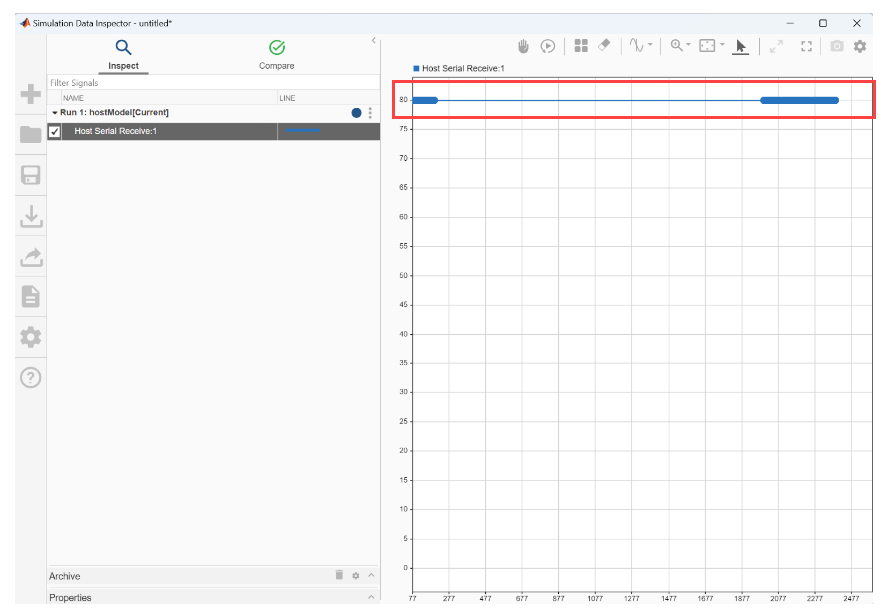
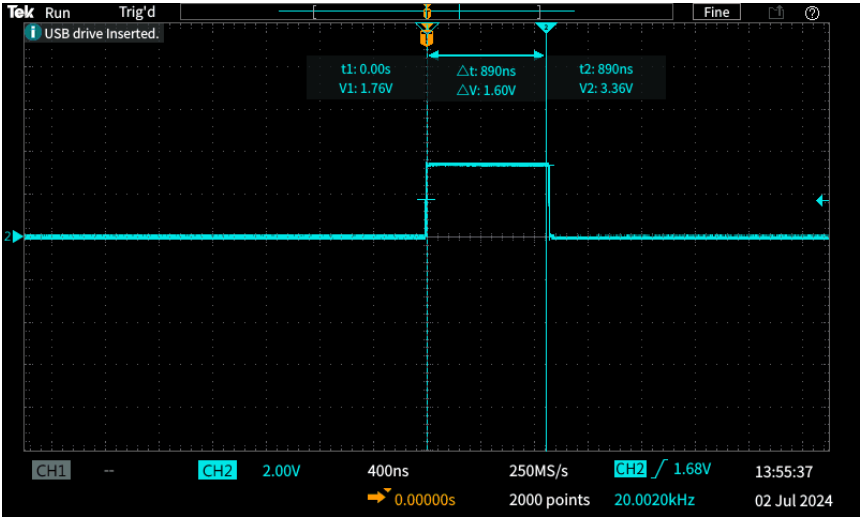
GPIO. Observe the GPIO results in the DSO.
Debugger Based Profiling
Observe the debugger based profiling results of Trignometric Profile subsystem.

Click Code Profiling Analyzer link to view the profiler analysis window.
Monitor and Tune Profiling
Observe the Monitor and Tune profiling results of Trignometric Profile subsystem.

PIL Profiling
Observe the PIL profiling results of Trignometric Profile subsystem.

This table provides comparison profiling results for each method obtained for the
Simulink Quick Insert Sin-Cos function call.
| Profiling Method | Timings in Microseconds |
|---|---|
| Debugger based profiling | 4.165 |
| Monitoring and Tuning | 4.48 |
| Processor-In-the-Loop (PIL) | 1.56 |
| General-Purpose Input/Output (GPIO) | 0.89 |
| Embedded Real-Time Analysis and Diagnostics (ERAD) | 0.83 |
| Timer | 0.8 |
See Also
Hardware Profiler | Code Execution Profiling on Texas Instruments C2000 | Detect and Fix Task Overruns on Texas Instruments C2000 Hardware | Enhance Code Execution Speed in TI C2000 Simulink Applications