Utilize Hardware Profiler for Real-Time Execution Profiling
This example demonstrates how to utilize the Hardware Profiler block for real-time execution profiling of algorithms using the C2000™ Microcontroller Blockset.
In this example, you can also perform execution time profiling of the Sensorless Field-Oriented Control of PMSM using C2000™ processors.
Introduction
The Hardware Profiler block enables you to profile function-call subsystem on target hardware using General Purpose Input Output (GPIO), Embedded Real-Time Analysis & Diagnostic (ERAD), and Timer Measurement modes.
GPIO: Set and clear GPIO pins before and after the execution of downstream function-call subsystems.
ERAD: Measure and analyze the execution times of start-to-end downstream function-call subsystems.
Timer: Measure execution time of events by calculating the duration between pre-execution and post-execution timer counts.
Note:
The Hardware Profiler block supports GPIO and Timer based measurements for all TI targets. ERAD based measurements are supported only for the selected boards.
The Hardware Profiler block in ERAD measurement mode consistently provides the maximum execution time.
Prerequisites
Required Hardware
To run this example, you can use any TI™ C2000™ hardware. For your convenience, this example is preconfigured to run on TI Piccolo F280049C Launchpad hardware.
However the steps to perform profiling on any TI™ C2000™ hardware with the required configurations is explained in the example.
Available Models
The example includes these models:
gettingstartedwithhardwareprofiler.slxprofiling_mcb_pmsm_foc_sensorless_f280049C.slxtarget modelprofiling_mcb_pmsm_foc_host_model.slxhost model
Model
Open the gettingstartedwithhardwareprofiler.slx model.
open_system('gettingstartedwithhardwareprofiler.slx')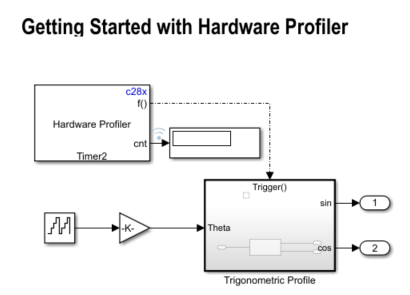
Create, Configure, and Run Model
Follow these steps to create and configure a simple model to run on the TI C2000 hardware.
1. Enter slLibraryBrowser at the MATLAB® prompt to open the Simulink® Library Browser.
2. Navigate to Libraries > C2000™ Microcontroller Blockset > Scheduling and select Hardware Profiler block**.**
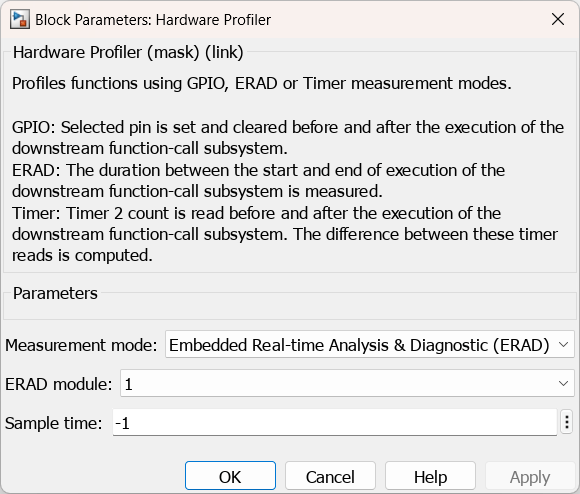
3. Double-click the Hardware Profiler block. Review the block mask, which contains a description of the block and parameters for configuring.
4. In MATLAB, select HOME > New > Simulink Model.
5. Drag the Hardware Profiler block from the library to the model.
6. Set measurement mode to either ERAD, Timer, or GPIO.
Select the ERAD module for ERAD measurement mode.
Specify the GPIO number for GPIO measurement mode.
Ensure the Sample Time parameter matches the algorithm's original trigger time.
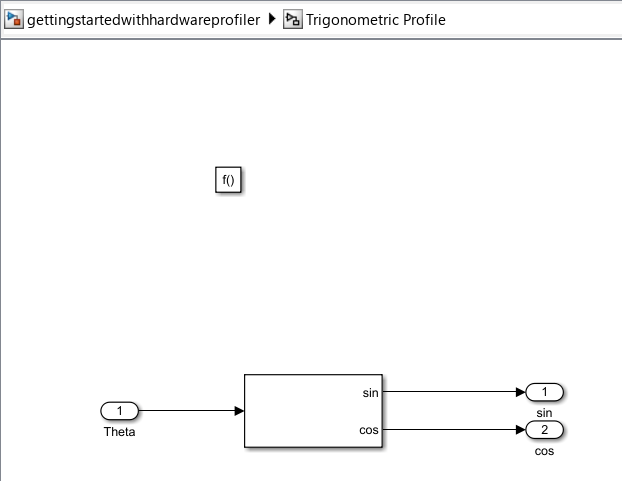
7. Add the function to be profiled into function-call subsystem.
8. Connect it to the function-call port in the Hardware Profiler.
For ERAD or Timer measurement modes, connect a Display block to the Count port.
For GPIO measurement mode, connect digital storage oscilloscope (DSO) to the GPIO pin and set the GPIO pin to be monitored for the width of the positive pulse.
Configure the Model
1. Open the gettingstartedwithhardwareprofiler.slx model.
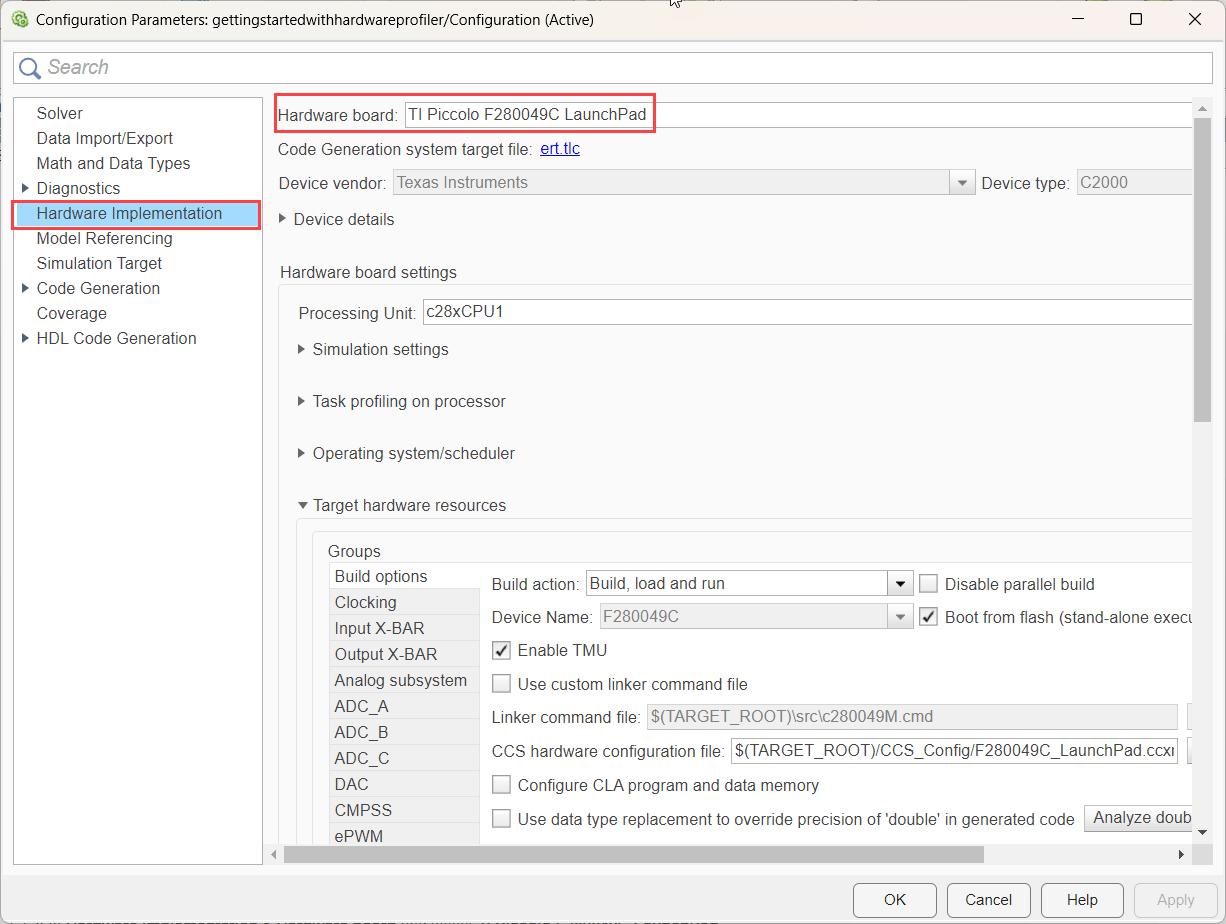
2. Open the Modeling tab and press Ctrl+E (Model settings) to open Configuration Parameters dialog box.
3. Go to Hardware Implementation > Hardware board and select TI Piccolo F280049C LaunchPad and click OK.
4. Click Monitor & Tune on the Hardware tab.

5. Observe the output in the Display block or in Simulation Data Inspector (SDI) for ERAD and Timer.
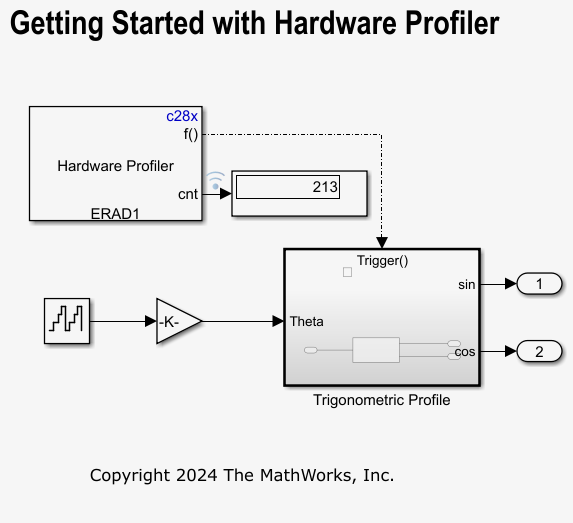
Hardware Profiler block with Timer and ERAD mode provide output in clock cycles. To convert it into seconds, use the following formula:

6. For GPIO measurement mode, click Build, Deploy & Start to generate code.
7. Observe the output and calculate the width of the positive pulse to determine execution time.
Analyzing Execution-Time of Motor Control Models
Open the profiling_mcb_pmsm_foc_sensorless_f280049C.slx target model. For your convenience, the TI Piccolo F280049C Launchpad hardware is preconfigured to execute this example.
Using this model, you can:
Profile and analyze the execution time of subsystems using the Hardware Profiler block.
Profile individual blocks within the model.
Benchmark the results obtained from the profiling.
To run the model on any other supported TI hardware boards, follow these configurations:
open_system('profiling_mcb_pmsm_foc_sensorless_f280049C.slx') 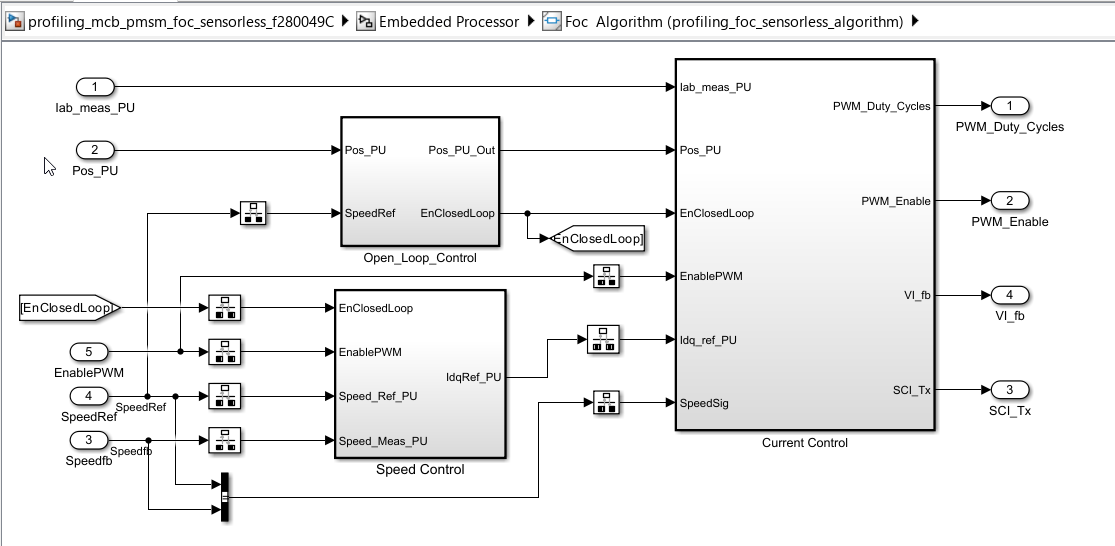
Configure Model
Configure the profiling_mcb_pmsm_foc_sensorless_f280049C.slx model by following the steps shown in Configure the Model section**.**
Profiling Subsystems Using Hardware Profiler
Use profiling_mcb_pmsm_foc_sensorless_f280049C.slx model to perform subsystem profiling. Follow these steps to profile the subsystem:
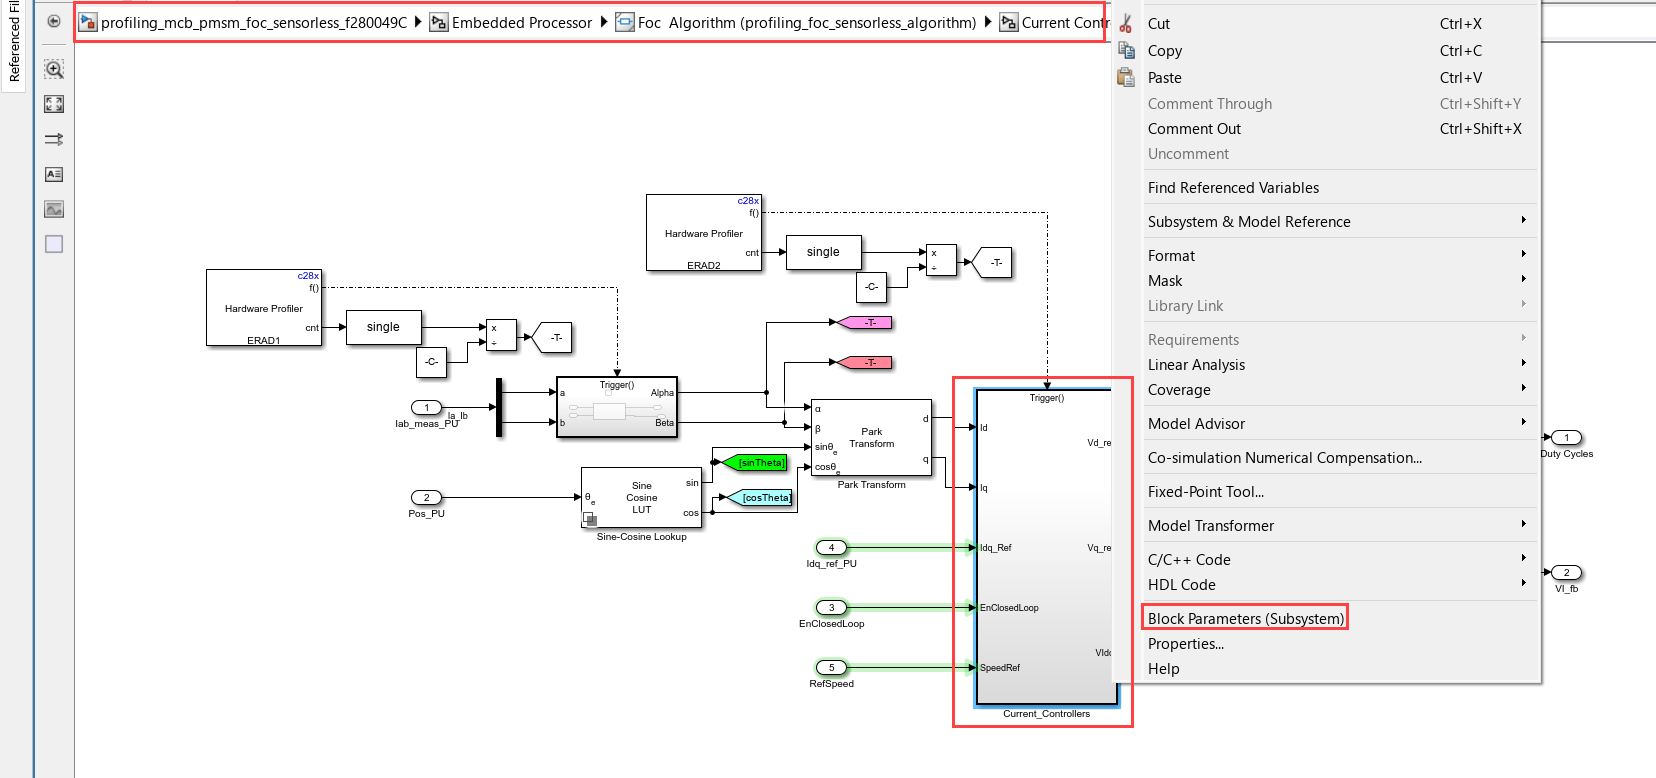
1. Select the Subsystem to be profiled:
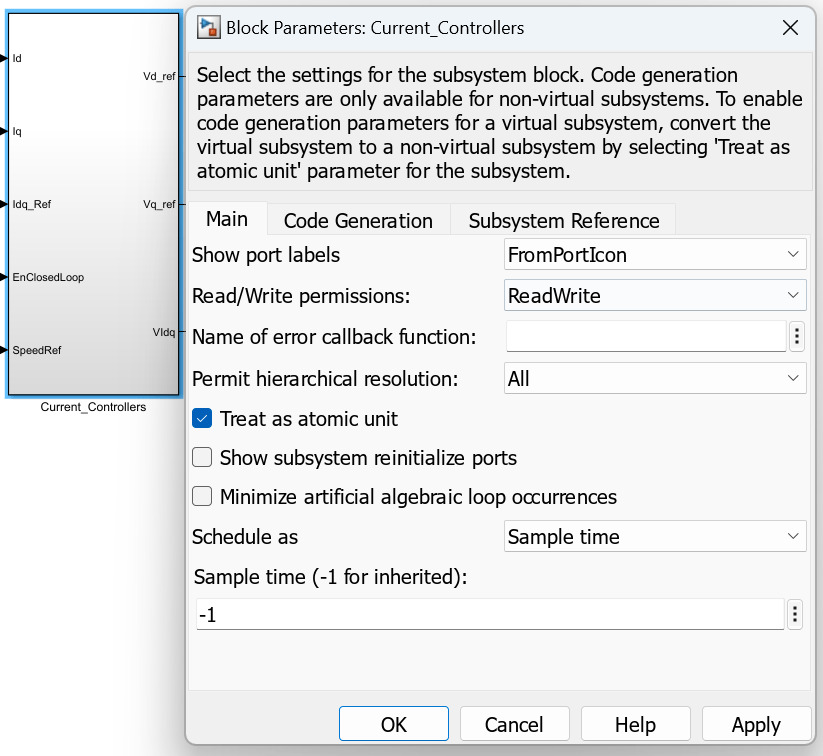
In this example, the highlighted subsystem is Current_Controllers.
Right click on the Current_Controllers subsystem and select Block Parameters (subsystem).
2. Enable Treat as atomic unit:
Enable the Treat as atomic unit parameter. This ensures that the software treats the subsystem as a single unit when determining the execution order of block methods.
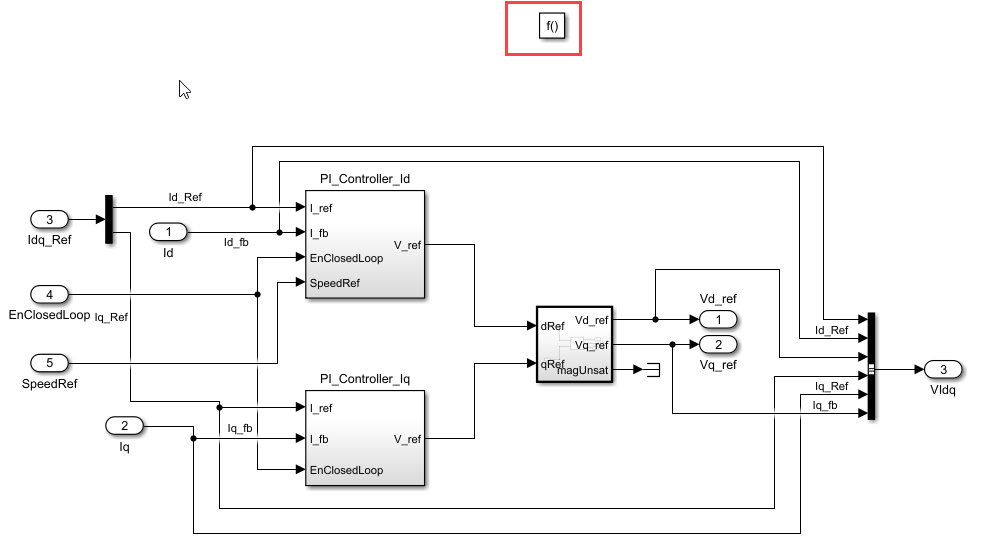
3. Insert a Trigger Block:
Double-click on the subsystem. Insert a Trigger block, then double-click on the Trigger block to open its properties and set the Trigger type to function-call.
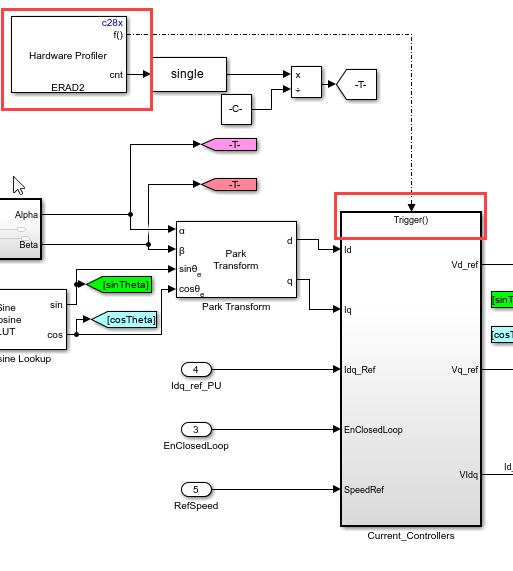
4. Add a Hardware Profiler Block:
Return to the level above the function-call subsystem
(profiling_mcb_pmsm_foc_sensorless_f280049C/Embedded Processor/Foc Algorithm (profiling_foc_sensorless_algorithm)/Current Control/Closed Loop) and add a Hardware Profiler block.Connect the function-call port to the function-call trigger of the subsystem.
Convert the Count port output to a single datatype and then divide it by a large factor. For example, for this subsystem, as the execution time is expected to be in the hundreds, divide it by
10,000.
5. Create an additional input port on the SCI transmit bus and connect the Count signal to this port (profiling_mcb_pmsm_foc_sensorless_f280049C/Embedded Processor/Foc Algorithm (profiling_foc_sensorless_algorithm)/Current Control).
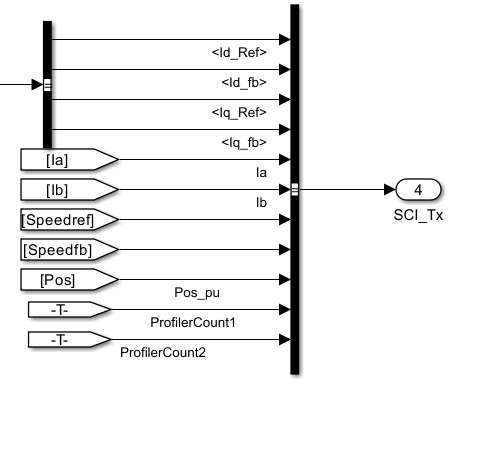
6. In the Debug_signals, add ports to the Bus Selector and specify the index to be selected.
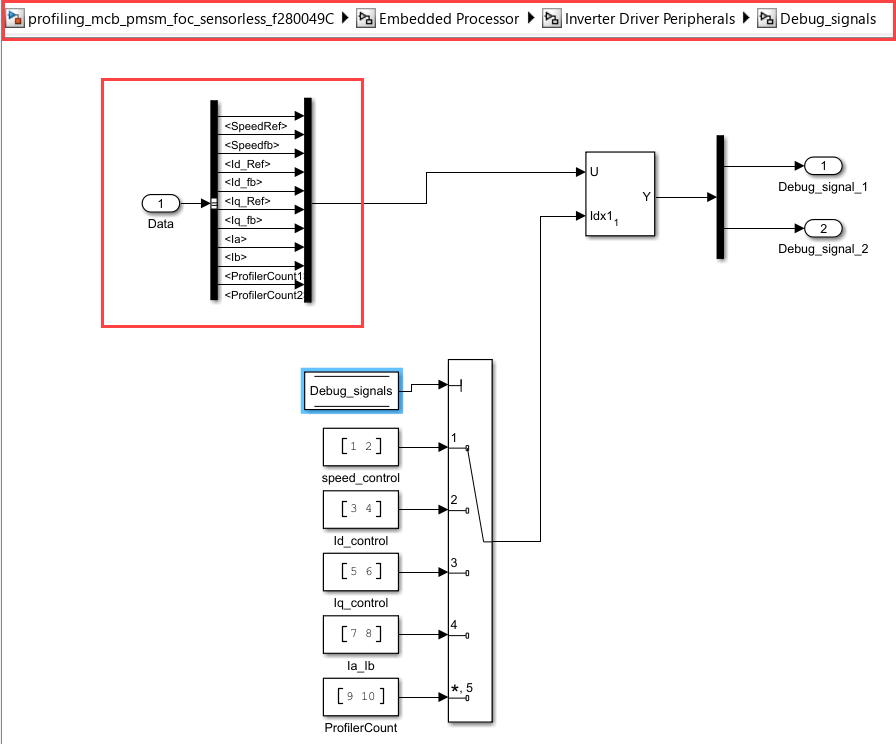
7. Include Constant in Host Model:
Open the
profiling_mcb_pmsm_foc_host_model.slxhost model(profiling_mcb_pmsm_foc_host_model/Serial Communication/Convert_to_SI_Units) and include the Constant to divide the profiler output.
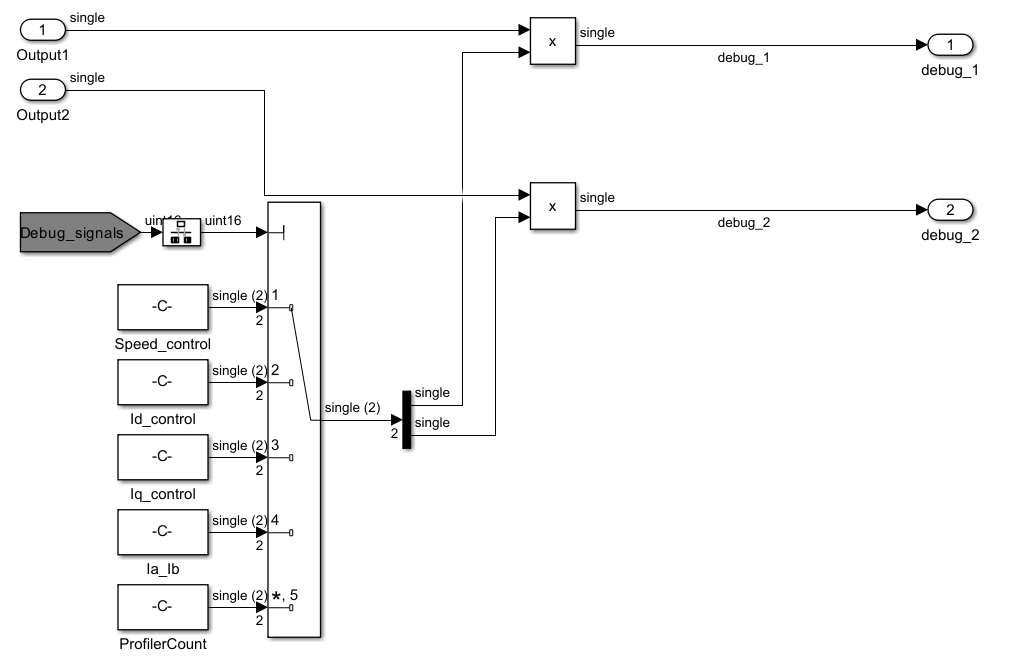
Generate Code and Run Model on Target Hardware
1. Click Build, Deploy & Start on the Hardware tab to deploy the target model to the hardware.
2. Perform the steps 7 to 12 from Sensorless Field-Oriented Control of PMSM Using C2000 Processors to configure serial host and motor position of the host model.
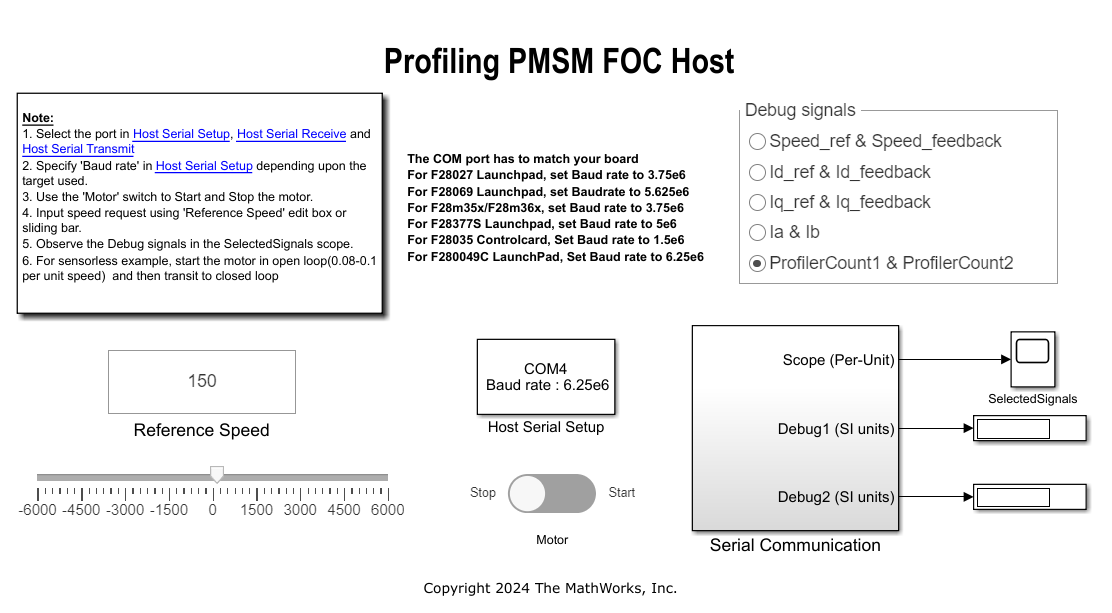
Measure Block Execution Time
In this task, you will profile an individual block within a Simulink model to measure its execution time. Follow these steps to profile the blocks:
1. Open the target model.
2. Right-click on the block to be profiled. Under the Subsystem & Model Reference option, select Create Subsystem from Selection.
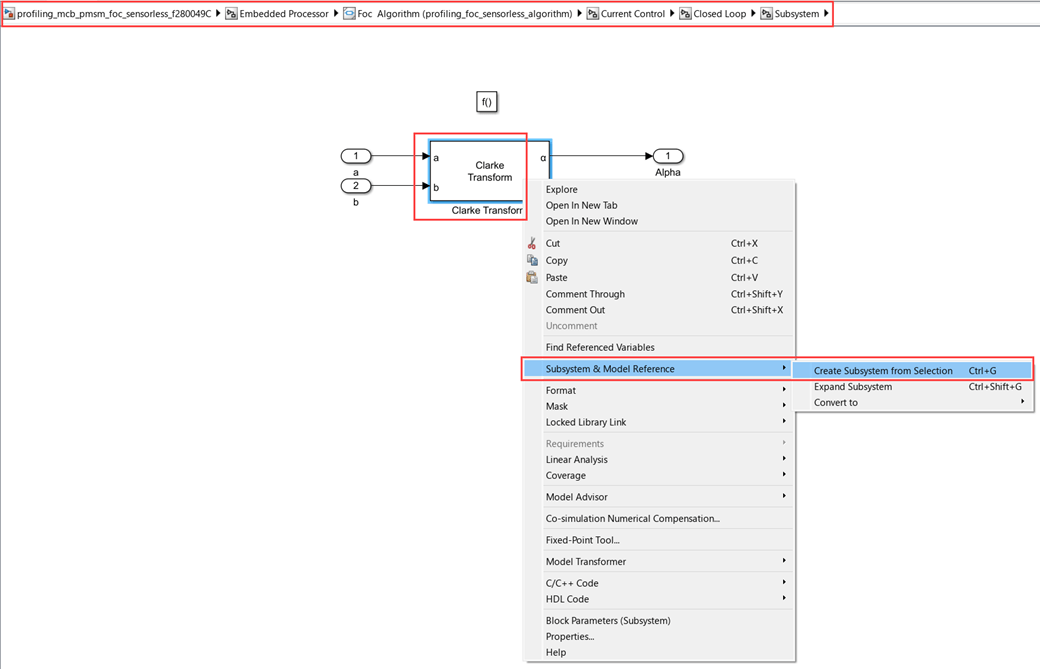
Since the block is now contained within a subsystem, you can proceed with the entire profiling function-call subsystem workflow as described in the section Profiling Subsystem Using Hardware Profiler.
Benchmarking Results
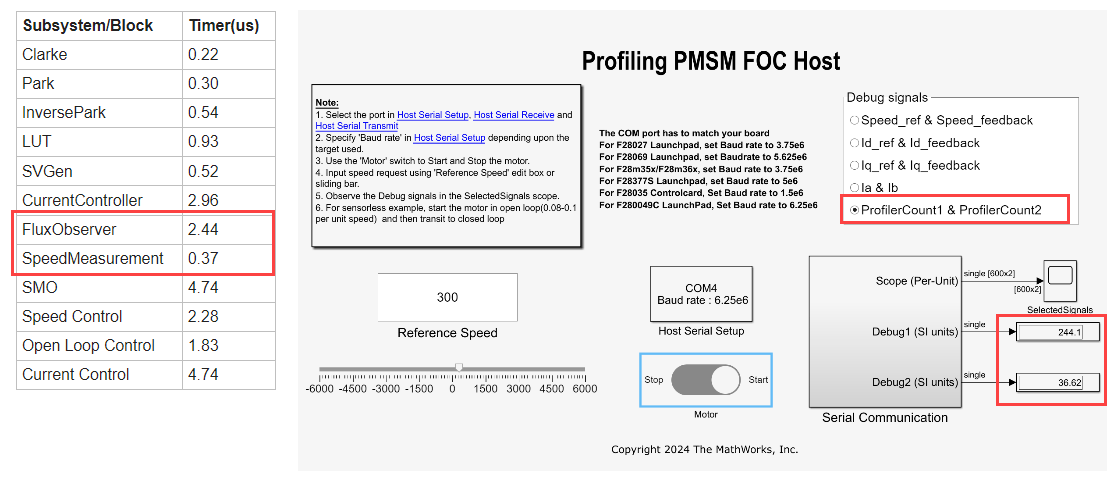
The following results are observed when profiling subsystems and blocks with the Hardware Profiler block set to Timer measurement mode. These results are obtained using the following configuration:
TI Board: F280049C LaunchPad running at 100 MHz
Motor: BLY172S at 3000RPM
Datatype: Floating point
You can observe the profiling timer results for FluxObserver and SpeedMeasurement blocks.
