plot
Plot parametric model
Description
plot(
specifies options using one or more name-value arguments in addition to argument from
previous syntax. For example, model,Name=Value)plot(model,Parent=gca) sets the color of
the plot to red.
Examples
Load a MAT file containing a point cloud into the workspace.
load("object3d.mat");Display the point cloud.
figure
pcshow(ptCloud)
title("Detect a Cylinder in a Point Cloud")
Set the maximum point-to-cylinder distance for cylinder fitting to 5mm.
maxDistance = 0.005;
Specify a region of interest (ROI) to constrain the fitting function.
roi = [0.4 0.6; -inf 0.2; 0.1 inf];
sampleIndices = findPointsInROI(ptCloud,roi);
Set the orientation constraint for the fitting function
referenceVector = [0 0 1];
Detect the cylinder in the specified ROI of the point cloud and extract it.
model = pcfitcylinder(ptCloud,maxDistance,referenceVector, ...
        SampleIndices=sampleIndices);
Plot the model of the detected cylinder.
hold on
plot(model)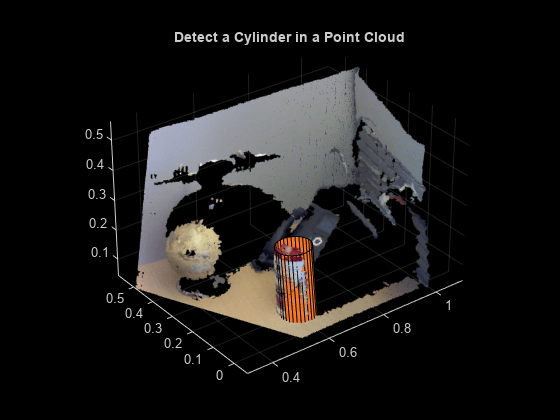
Load a point cloud into the workspace.
load("object3d.mat");Display the point cloud and label the figure.
figure
pcshow(ptCloud)
title("Detect a sphere in a point cloud")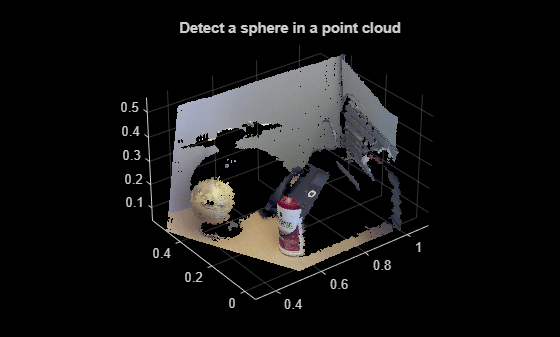
Set the maximum point-to-sphere distance for sphere fitting to 1cm.
maxDistance = 0.01;
Set the region of interest to constrain the search.
roi = [-inf,0.5;0.2,0.4;0.1,inf];
sampleIndices = findPointsInROI(ptCloud,roi);
Detect the globe in the point cloud and extract it.
[model,inlierIndices] = pcfitsphere(ptCloud,maxDistance,SampleIndices=sampleIndices);
globe = select(ptCloud,inlierIndices);
Plot the extracted globe.
figure
pcshow(globe)
title("Globe Point Cloud")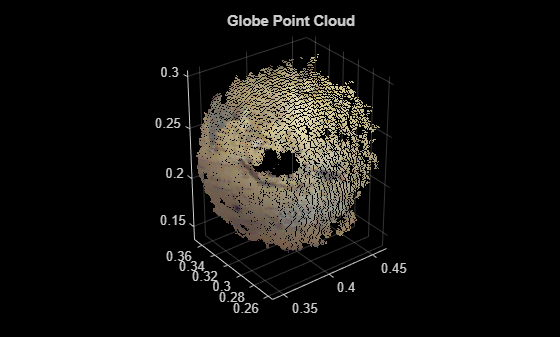
Load a MAT file containing a point cloud.
load("object3d.mat");Display the point cloud into the workspace.
figure
pcshow(ptCloud)
title("Detect a Plane in a Point Cloud")
Set the maximum point-to-plane distance for plane fitting to 2cm.
maxDistance = 0.02;
Specify the normal vector plane for the fitted plane.
referenceVector = [0 0 1];
Set the maximum angular distance for the fitted plane to 5 degrees.
maxAngularDistance = 5;
Detect the plane, the table, in the point cloud and extract it.
model = pcfitplane(ptCloud,maxDistance,referenceVector,maxAngularDistance);
Plot the plane.
hold on
plot(model)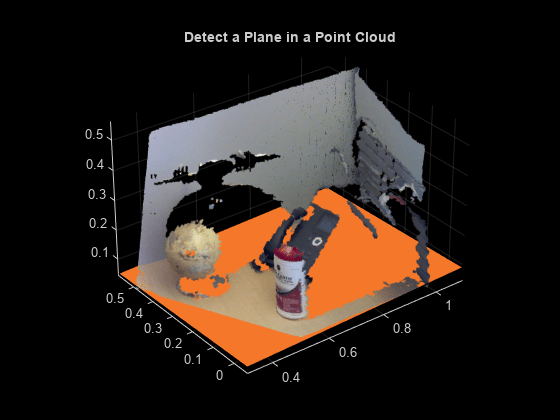
Input Arguments
Name-Value Arguments
Specify optional pairs of arguments as
Name1=Value1,...,NameN=ValueN, where Name is
the argument name and Value is the corresponding value.
Name-value arguments must appear after other arguments, but the order of the
pairs does not matter.
Example:
plot(model,Parent=gca) sets the output axes to the current axes in the
current figure.
Color of the plane, specified as a 1-by-3 RGB vector or a short or long color name. The default color [245 119 41] is well-suited for visualizing the model when fitting it to point clouds.
| Color Name | Short Name | RGB Triplet | Appearance |
|---|---|---|---|
"red" | "r" | [1 0 0] |
|
"green" | "g" | [0 1 0] |
|
"blue" | "b" | [0 0 1] |
|
"cyan"
| "c" | [0 1 1] |
|
"magenta" | "m" | [1 0 1] |
|
"yellow" | "y" | [1 1 0] |
|
"black" | "k" | [0 0 0] |
|
"white" | "w" | [1 1 1] |
|
Output Arguments
Version History
Introduced in R2015b