plot
Description
plot( plots the 3-D map points and
estimated camera trajectory from the visual SLAM object vslam)vslam.
plot(
specifies options using one or more name-value arguments. For example,
vslam,Name=Value)MarkerSize=10 sets the diameter of the marker size to 10 points.
ax = plot(___)
Examples
Perform monocular visual simultaneous localization and mapping (vSLAM) using the data from the TUM RGB-D Benchmark. You can download the data to a temporary directory using a web browser or by running this code:
baseDownloadURL = "https://cvg.cit.tum.de/rgbd/dataset/freiburg3/rgbd_dataset_freiburg3_long_office_household.tgz";
dataFolder = fullfile(tempdir,"tum_rgbd_dataset",filesep);
options = weboptions(Timeout=Inf);
tgzFileName = dataFolder+"fr3_office.tgz";
folderExists = exist(dataFolder,"dir");

% Create a folder in a temporary directory to save the downloaded file
if ~folderExists
    mkdir(dataFolder)
    disp("Downloading fr3_office.tgz (1.38 GB). This download can take a few minutes.")
    websave(tgzFileName,baseDownloadURL,options);

    % Extract contents of the downloaded file
    disp("Extracting fr3_office.tgz (1.38 GB) ...")
    untar(tgzFileName,dataFolder);
end
Create an imageDatastore object to store all the RGB images.
imageFolder = dataFolder+"rgbd_dataset_freiburg3_long_office_household/rgb/";
imds = imageDatastore(imageFolder);
Specify your camera intrinsic parameters, and use them to create a monocular visual SLAM object.
intrinsics = cameraIntrinsics([535.4 539.2],[320.1 247.6],[480 640]);
vslam = monovslam(intrinsics,SkipMaxFrames=15);
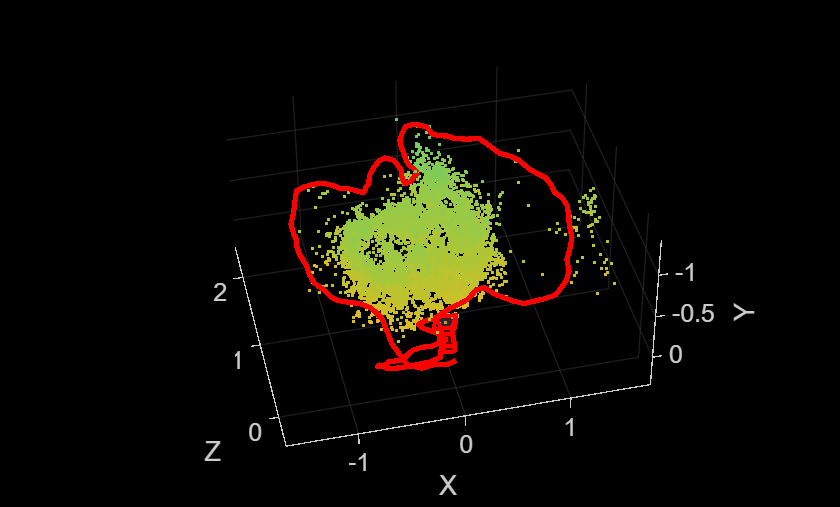
Process each image frame, and visualize the camera poses and 3-D map points. Note that the monovslam object runs several algorithm parts on separate threads, which can introduce a latency in processing of an image frame added by using the addFrame function.
for i = 1:numel(imds.Files)
    addFrame(vslam,readimage(imds,i))

    if hasNewKeyFrame(vslam)
        % Display 3-D map points and camera trajectory
        plot(vslam);
    end

    % Get current status of system
    status = checkStatus(vslam);
end

Plot intermediate results and wait until all images are processed.
while ~isDone(vslam)
    if hasNewKeyFrame(vslam)
        plot(vslam);
    end
end
After all the images are processed, you can collect the final 3-D map points and camera poses for further analysis.
xyzPoints = mapPoints(vslam);
[camPoses,addedFramesIdx] = poses(vslam);
% Reset the system
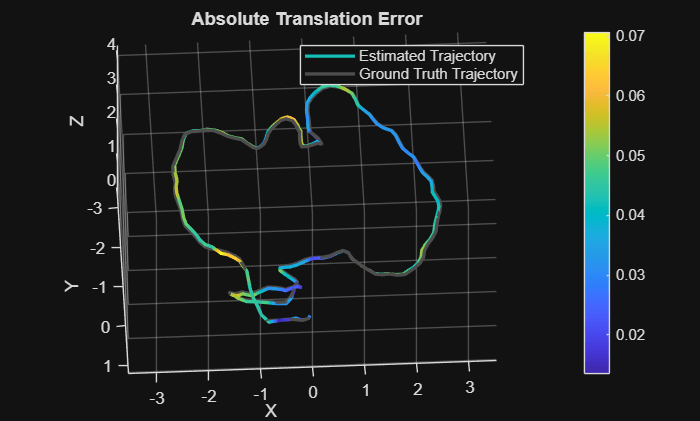
reset(vslam)Compare the estimated camera trajectory with the ground truth to evaluate the accuracy.
% Load ground truth
gTruthData = load("orbslamGroundTruth.mat");
gTruth     = gTruthData.gTruth;

% Evaluate tracking accuracy
mtrics = compareTrajectories(camPoses, gTruth(addedFramesIdx), AlignmentType="similarity");
disp(['Absolute RMSE for key frame location (m): ', num2str(mtrics.AbsoluteRMSE(2))]);
Absolute RMSE for key frame location (m): 0.043641
% Plot the absolute translation error at each key frame
figure
ax = plot(mtrics, "absolute-translation");
view(ax, [2.70 -49.20]);
Input Arguments
Name-Value Arguments
Output Arguments
Version History
Introduced in R2023b
See Also
Objects
Functions
checkStatus|isDone|addFrame|poses|mapPoints|reset|hasNewKeyFrame