customArrayGeometry
Create array represented by 2-D custom geometry
Description
The customArrayGeometry object is an array represented by a
2-D custom geometry on the xy-plane. You can use the
customArrayGeometry to import a 2-D custom geometry, define feeds
to create an array element, and analyze the custom array.
Creation
Description
array = customArrayGeometry
array = customArrayGeometry(PropertyName=Value)PropertyName is the property name
and Value is the corresponding value. You can specify
several name-value arguments in any order as
PropertyName1=Value1,...,PropertyNameN=ValueN.
Properties that you do not specify, retain their default values.
For example, ca = customArrayGeometry(PhaseShift=10)
applies a phase shift of 10 degrees to the elements in the custom
geometry.
Output Arguments
Properties
Object Functions
axialRatio | Calculate and plot axial ratio of antenna or array |
beamwidth | Beamwidth of antenna |
charge | Charge distribution on antenna or array surface |
correlation | Correlation coefficient between two antennas in array |
current | Current distribution on antenna or array surface |
efficiency | Calculate and plot radiation efficiency of antenna or array |
EHfields | Electric and magnetic fields of antennas or embedded electric and magnetic fields of antenna element in arrays |
feedCurrent | Calculate current at feed for antenna or array |
impedance | Calculate and plot input impedance of antenna or scan impedance of array |
info | Display information about antenna, array, or platform |
layout | Display array or PCB stack layout |
mesh | Generate and view mesh for antennas, arrays, and custom shapes |
meshconfig | Change meshing mode of antenna, array, custom antenna, custom array, or custom geometry |
msiwrite | Write antenna or array analysis data to MSI planet file |
pattern | Plot radiation pattern of antenna, array, or embedded element of array |
patternAzimuth | Azimuth plane radiation pattern of antenna or array |
patternElevation | Elevation plane radiation pattern of antenna or array |
peakRadiation | Calculate and mark maximum radiation points of antenna or array on radiation pattern |
rcs | Calculate and plot monostatic and bistatic radar cross section (RCS) of platform, antenna, or array |
returnLoss | Calculate and plot return loss of antenna or scan return loss of array |
show | Display antenna, array, AI-based antenna, platform, or shape |
sparameters | Calculate S-parameters for antenna or array |
stlwrite | Write mesh information to STL file |
vswr | Calculate and plot voltage standing wave ratio (VSWR) of antenna or array element |
Examples
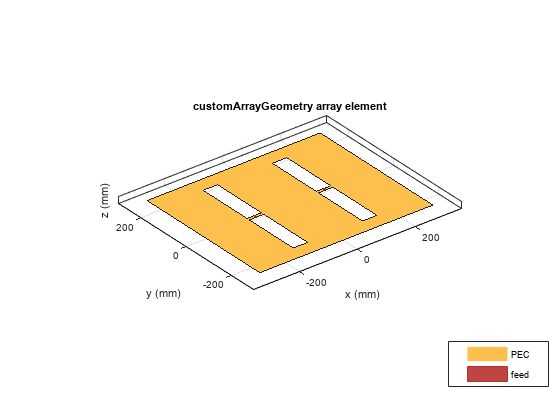
Create and visualize a custom array using customArrayGeometry. Plot the impedance and current distribution of the array.
Create a ground plane with a length of 0.6 m and a width of 0.5 m.
Lp  = 0.6;
Wp  = 0.5;
p1  = antenna.Rectangle(Length=Lp, Width=Wp);
Create slots of length 0.05 m and width 0.4 m on the ground plane.
Add strips of length 0.05 m and width 0.01 m in between the slots for housing the feed point.
Ls  = 0.05;
Ws  = 0.4;
offset = 0.12;
p2 = antenna.Rectangle(Length=Ls, Width=Ws, Center=[-offset 0]);
p3 = antenna.Rectangle(Length=Ls, Width=Ws, Center=[offset 0]);
Wf  = 0.01;
p4   = antenna.Rectangle(Length=Ls, Width=Wf, Center=[-offset 0]);
p5   = antenna.Rectangle(Length=Ls, Width=Wf, Center=[offset 0]);
Create custom array using the slotted ground plane. Create a feed in between the slots on the ground plane.
b1 = getShapeVertices(p1);
b2 = getShapeVertices(p2);
b3 = getShapeVertices(p3);
b4 = getShapeVertices(p4);
b5 = getShapeVertices(p5);
carray = customArrayGeometry;
carray.Boundary = {b1,b2,b3,b4,b5}';
carray.Operation = 'P1-P2-P3+P4+P5';
carray.NumFeeds = 2;
carray.FeedLocation = [-offset 0 0; offset 0 0];
carray.FeedWidth = [Wf Wf];
Visualize the array.
figure
show(carray)
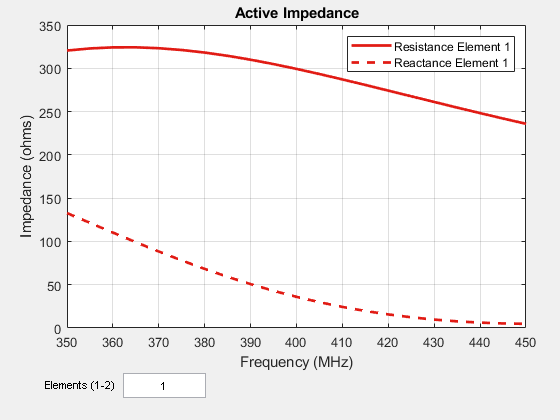
Calculate the impedance of the array using the frequency range of 350 MHz to 450 MHz.
figure
impedance(carray, 350e6:5e6:450e6)
Visualize the current distribution of the array at 410 MHz.
figure
current(carray, 410e6, Scale="log10")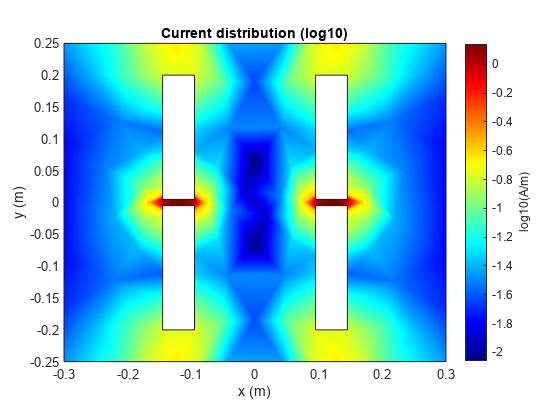
References
[1] Balanis, C. A. Antenna Theory. Analysis and Design. 3rd Ed. Hoboken, NJ: John Wiley & Sons, 2005.
Version History
Introduced in R2017a