Lowess 平滑
关于 Lowess 平滑
使用 Lowess 模型对您的数据进行平滑曲面拟合。lowess 和 loess 这两个名称源于术语“局部加权散点图平滑”,因为这两种方法都使用局部加权线性回归对数据进行平滑处理。该过程是加权的,因为工具箱为跨度内包含的数据点定义一个回归权重函数。除了回归权重函数之外,还有一个稳健选项,它是一个权重函数,可使处理过程不受离群值影响。
有关这两种平滑拟合的详细信息,请参阅Local Regression Smoothing。
以交互方式选择 Lowess 拟合
通过在 MATLAB® 命令行中输入 curveFitter 打开曲线拟合器。或者,在 App 选项卡上的数学、统计和优化组中,点击曲线拟合器。
在曲线拟合器选项卡的拟合类型部分中,选择 Lowess 拟合。该 App 使用局部加权线性回归对数据进行平滑处理。
在拟合选项窗格中,您可以尝试不同拟合选项。
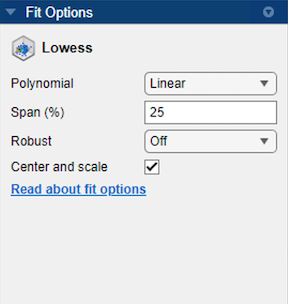
您可以将回归多项式模型设置为
Linear或Quadratic。您可以使用跨度将跨度设置为数据集中数据点总数的百分比。该 App 使用跨度内定义的相邻数据点来确定每个平滑值。此平滑过程称为“局部”平滑。
提示
增大跨度可使曲面更平滑。减小跨度可使曲面与数据更吻合。
您可以将稳健线性最小二乘拟合方法设置为
Off、LAR或Bisquare。局部回归使用稳健选项。使用稳健权重函数可以使平滑不受离群值的影响。有关详细信息,请参阅fitoptions函数的Robust名称-值参量。
提示
如果您的数据变量的缩放相差很大,请选中和清除中心化和缩放复选框以查看在拟合中的差异。归一化变量会强烈影响 lowess 拟合的结果。
有关如何以交互方式创建 lowess 拟合的示例,请参阅Surface Fitting to Franke Data。
使用 fit 函数进行 Lowess 模型拟合
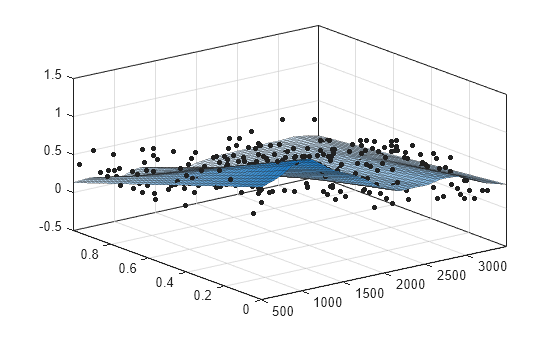
此示例说明如何使用 fit 函数对数据进行 Lowess 模型拟合。
加载一些数据,并通过在调用 fit 函数时指定 'lowess' 来拟合一个 Lowess 模型。
load franke
f = fit([x y],z,'lowess')
f =
     Locally weighted smoothing linear regression:
       f(x,y) = lowess (linear) smoothing regression computed from p
     Coefficients:
       p = coefficient structure
plot(f,[x y],z)
有关 Lowess 模型拟合的命令行示例,请参阅Fit Smooth Surfaces to Investigate Fuel Efficiency。