Profile Your Deep Learning Code to Improve Performance
This example shows how to profile deep learning training code to identify and resolve performance issues.
Profiling is a way to measure the time it takes to run your code and identify where MATLAB® spends the most time. After you identify which parts of your code are consuming the most time, you can edit your code to improve performance. Training a deep neural network is commonly the most time-consuming step in a deep learning workflow. If you intend to experiment by training several networks, or train a single network for a long time, spending time to optimize your training code can save time overall.
In this example, you profile network training, inspect the profile, and improve your training code to reduce training time.
Load Pretrained Network
Load a pretrained ResNet-50 network. If the Deep Learning Toolbox Model for ResNet-50 Network support package is not installed, then the software provides a download link. ResNet-50 is trained on more than a million images and can classify images into 1000 object categories, such as keyboard, mouse, pencil, and many animals. This example uses transfer learning to retrain a ResNet-50 pretrained network for image classification.
Load the pretrained network, specifying number of classes as 5 to adapt the network for classification tasks with 5 classes, and extract the image input size.
net = imagePretrainedNetwork("resnet50",NumClasses=5);
inputSize = net.Layers(1).InputSize;
Prepare Data
Download and extract the Flowers data set from http://download.tensorflow.org/example_images/flower_photos.tgz. The Flowers data set contains 3670 images of flowers belonging to five classes (daisy, dandelion, roses, sunflowers, and tulips) [1]. The data set is about 218 MB. Set downloadFolder to the location of the data.
url = "http://download.tensorflow.org/example_images/flower_photos.tgz";
downloadFolder = tempdir;
filename = fullfile(downloadFolder,"flower_dataset.tgz");

dataFolder = fullfile(downloadFolder,"flower_photos");
if ~exist(dataFolder,"dir")
    fprintf("Downloading Flowers data set (218 MB)... ")
    websave(filename,url);
    untar(filename,downloadFolder)
    fprintf("Done.\n")
end
Downloading Flowers data set (218 MB)...
Done.
Load the data as an image datastore using the imageDatastore function and specify the folder containing the image data.
imds = imageDatastore(dataFolder, ...
    IncludeSubfolders=true, ...
    LabelSource="foldernames");
Split the image datastore into training and validation datastores.
[imdsTrain,imdsVal] = splitEachLabel(imds,0.8,0.2);
Create augmented image datastores containing the images and an image augmentation scheme.
pixelRange = [-30 30];
imageAugmenter = imageDataAugmenter( ...
    RandXReflection=true, ...
    RandXTranslation=pixelRange, ...
    RandYTranslation=pixelRange);

augimdsTrain = augmentedImageDatastore(inputSize(1:2),imdsTrain, ...
    DataAugmentation=imageAugmenter);
augimdsVal = augmentedImageDatastore(inputSize(1:2),imdsVal);
Profile Network Training
When you train a network, MATLAB initially spends some time preparing the network and the training data. This one-time setup can take several seconds, which is insignificant when you train for a long time. When you profile your training code, you should usually focus on the training iterations rather than this setup.
To profile training only after the initial setup, define a function, profilingManager, that:
Takes a
structof training information,info, as input that includes a field indicating the number of iterations that have elapsed.Starts the Profiler after iteration 10 and stops the Profiler after iteration 50. This avoids profiling the one-time setup that occurs at the start of training. Use the
profilefunction to start and stop the Profiler and display the results in the Profiler window. Increase the number of function entry and exit events that the Profiler will record by setting thehistorysizeargument to10000000. Increasing the default history size is necessary in order to see a flame graph of the profiled code, as a single call totrainnettriggers a number of function entries and exits that usually exceeds the default.Returns a flag,
stopTraining, that isfalse(0) until 50 training iterations have elapsed, at which point it is returned astrue(1). This flag will stop the training after iteration 50.
function stopTraining = profilingManager(info)
stopTraining = false;

% Start profiling after 10 iterations and stop after 50.
if info.Iteration == 10
    profile on -historysize 10000000
elseif info.Iteration == 50
    profile viewer
    stopTraining = true;
end

end
Using the Profiler can change the behavior of your code by disabling certain optimizations. In particular, because it runs each line of code independently, it does not account for overlapping execution, which is common when you use a GPU. You can use tic and toc to double check Profiler times against the wall clock times you are seeing without the Profiler. For more information see Measure and Improve GPU Performance (Parallel Computing Toolbox).
Specify the options to use for training.
Train using an SGDM solver with an initial learning rate of 0.0005.
Set the mini-batch size to 64.
Specify the validation data and the validation frequency.
Plot the training progress and disable verbose output.
Use the
profilingManagerfunction as an output function. This output function starts profiling after iteration 10 and stops profiling and training after iteration 50.
options = trainingOptions("sgdm", ...
    InitialLearnRate=0.0005, ...
    MiniBatchSize=64, ...
    ValidationData=augimdsVal, ...
    ValidationFrequency=10, ...
    Plots="training-progress", ...
    Verbose= false, ...
    OutputFcn=@profilingManager);
Check whether a GPU is available for training. By default, the trainnet function uses a GPU if one is available. Training on a GPU requires a Parallel Computing Toolbox™ license and a supported GPU device. For information on supported devices, see GPU Computing Requirements (Parallel Computing Toolbox). Otherwise, the trainnet function uses the CPU. To select the execution environment manually, use the ExecutionEnvironment training option.
if canUseGPU
    gpu = gpuDevice;
    disp(gpu.Name + " GPU detected and available for training.")
end
NVIDIA RTX A5000 GPU detected and available for training.
Train the neural network using the trainnet function. For classification, use cross-entropy loss.
trainedNet = trainnet(augimdsTrain,net,"crossentropy",options);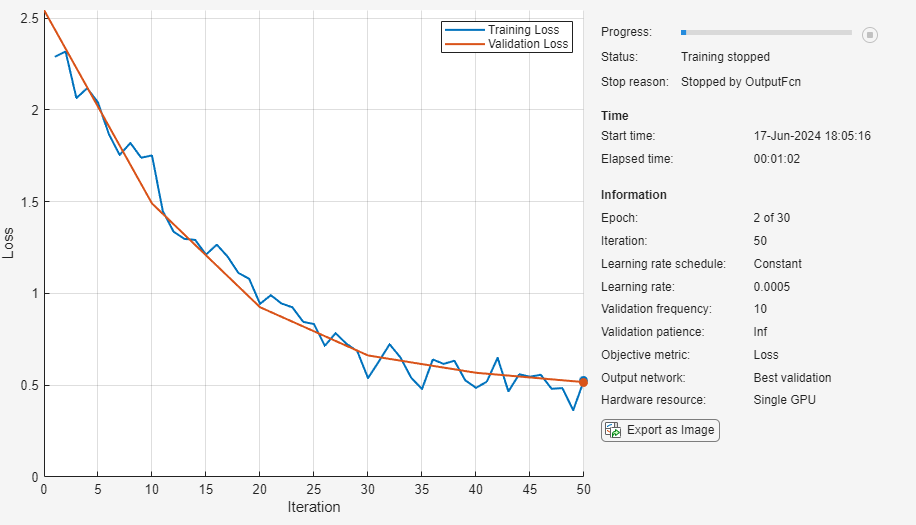
Extract the time spent inside the trainnet function from the Profiler.
profileInit = profile("info");
trainnetIndex = find(ismember({profileInit.FunctionTable.FunctionName},"trainnet"));
trainnetTimeInit = profileInit.FunctionTable(trainnetIndex).TotalTime;

fprintf('Time spent in trainnet call (40 iterations): %.2f s.',trainnetTimeInit)
Time spent in trainnet call (40 iterations): 32.01 s.
Inspect Profile
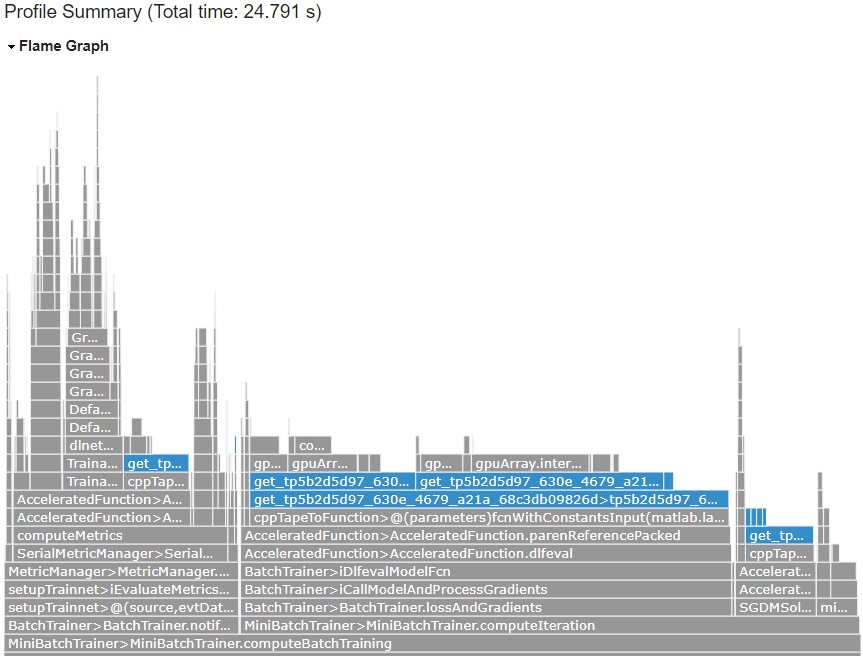
At the top of the Profile Summary results, a flame graph shows a visual representation of the time MATLAB spent running the code. Each function that was called is represented by a bar in the flame graph. You might recognize some function names, such as trainnet, but other functions are child functions that you did not call directly. Training a network involves many function calls and produces a complicated profile. This section highlights parts of the profile that might you might be able to use to identify long running code that you can improve or avoid calling.
The functions in the graph display in hierarchical order, with parent functions appearing lower on the graph, and child functions appearing higher on the graph. The bar that spans the entire bottom of the graph labeled Profile Summary represents all of the code that ran. The width of a bar on the graph represents the amount of time it took for the function to run as a percentage of the total run time.
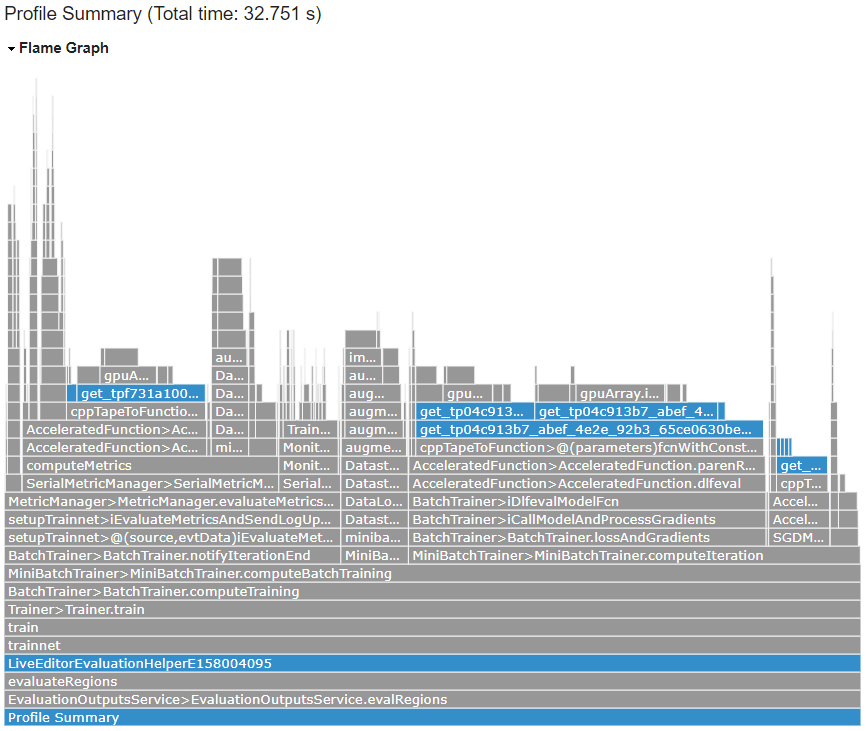
The function table below the flame graph, not shown here, displays similar information to the flame graph. Initially the functions appear in order of time they took to process.
Click on the bar labeled MiniBatchTrainer.computeBatchTraining (the eighth bar from the bottom). Clicking on a bar representing a function displays detailed information about that function including information about individual code lines.
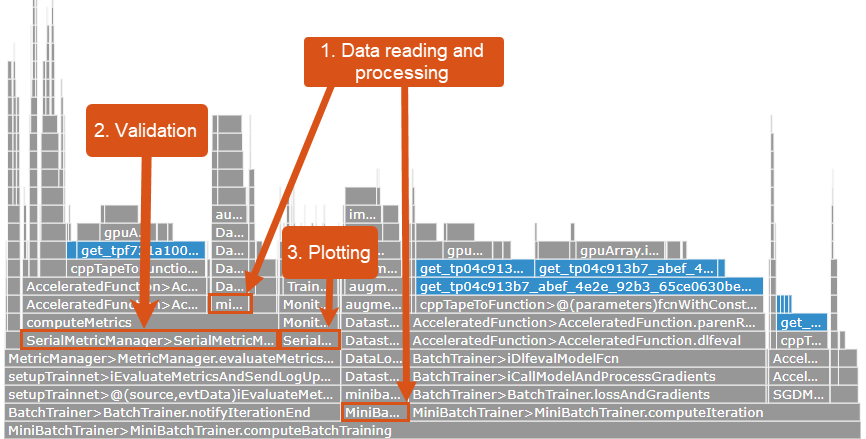
The flame graph now highlights the computeBatchTraining function and its child functions. The parts of the flame graph relating to these child functions are labeled in the image below. Inspect the names of these functions, use the function table to see how many times they are called, and inspect the names of their child functions. You can use the name of a function to infer what it does. For example, the computeValidation function computes the validation metrics.
BatchTrainer.notifyIterationEnd– this function table shows that this function was called 40 times. It calls functions namedcomputeValidationandupdateMonitor. It computes validation metrics and updates the training progress plot.MiniBatchSerialTrainingStrategy.continueThisEpoch– this function was called 40 times and calls several datastore related functions, includingread. It reads mini-batches from the training data datastore and applies the augmentations to the images.MiniBatchTrainer.computeIteration– this function was called 40 times and calls functions that calculate gradients and losses and update learnable parameters.

Identify Possible Performance Improvements
Once you have an understanding of how the parts of the profile correspond to the training process, you can begin to consider which parts you can affect to reduce training time. Some parts of the training process are easier to control than others, for example, the training options and data preprocessing are easier to change than the implementation of the solver. In this example, there are several parts of the training process that you might want to change.
Data preprocessing – the software spends a significant amount of time managing and reading from the training and validation datastores.
Validation – the software spends a significant amount of time calculating validation statistics using the
computeValidationfunction.Plotting – the software spends some time plotting the training statistics.
In your own code, other parts of the training process might dominate the profile and will require different approaches to optimize. Some of these are discussed at the end of this example. Some other opportunities for improving performance are not evident from a profile, such as using training using multiple GPUs. For tips on speeding up training, see Speed Up Deep Neural Network Training.
Edit Deep Learning Code
In this section, you change your deep learning code and training options based on the identified possible performance improvements.
Preprocess Data in Advance
The training and validation images are resized each time the trainnet function reads from the datastores. If you train the network for 100 epochs, then the trainnet function resizes every training image 100 times. One way to reduce the time spent preprocessing data is to resize all of the training and validation images in advance.
Use the transform function to create TransformedDatastore objects that resize the training and validation images only when you read from the datastores.
tdsTrain = transform(imdsTrain,@(I) imresize(I,inputSize(1:2)));
tdsVal = transform(imdsVal,@(I) imresize(I,inputSize(1:2)));
Use the writeall function to write the resized images to a location. If Parallel Computing Toolbox™ is installed and licensed for use, write the images in parallel.
imageLocationTrain = fullfile(dataFolder,"resizedTrainImages");
imageLocationVal = fullfile(dataFolder,"resizedValImages");

useParallel = canUseParallelPool;
writeall(tdsTrain,imageLocationTrain,OutputFormat="jpg",UseParallel=useParallel)
Starting parallel pool (parpool) using the 'Processes' profile ...
17-Jun-2024 18:14:28: Job Queued. Waiting for parallel pool job with ID 2 to start ...
Connected to parallel pool with 6 workers.
writeall(tdsVal,imageLocationVal,OutputFormat="jpg",UseParallel=useParallel)Recreate the datastores using the resized images. You can also optionally delete the original images.
imdsTrain = imageDatastore(imageLocationTrain, ...
    IncludeSubfolders=true, ...
    LabelSource="foldernames");

augimdsTrain = augmentedImageDatastore(inputSize(1:2),imdsTrain, ...
    DataAugmentation=imageAugmenter);

imdsVal = imageDatastore(imageLocationVal, ...
    IncludeSubfolders=true, ...
    LabelSource="foldernames");
Preprocessing the images using the background pool might also speed up training. Set the PreprocessingEnvironment training option to "background".
options.PreprocessingEnvironment = "background";Change Validation and Plotting Settings
Update the training options to reduce validation frequency and to output verbose training information to the command window instead of plotting training progress.
options.ValidationFrequency= 50;
options.Plots = "none";
options.Verbose = true;
Retrain Network
To check whether these changes speed up training, train the network again.
trainedNet = trainnet(imdsTrain,net,"crossentropy",options); Iteration Epoch TimeElapsed LearnRate TrainingLoss ValidationLoss
_________ _____ ___________ _________ ____________ ______________
0 0 00:00:11 0.0005 2.52
1 1 00:00:12 0.0005 2.1658
50 2 00:00:47 0.0005 0.38371 0.51351
Training stopped: Stopped by OutputFcn
Extract the time spent inside the trainnet function from the Profiler.
profileOpt = profile("info");
trainnetIndex = find(ismember({profileOpt.FunctionTable.FunctionName},"trainnet"));
trainnetTimeOpt = profileOpt.FunctionTable(trainnetIndex).TotalTime;
fprintf('Time spent in trainnet call (40 iterations): %.2f s.',trainnetTimeOpt)
Time spent in trainnet call (40 iterations): 23.75 s.
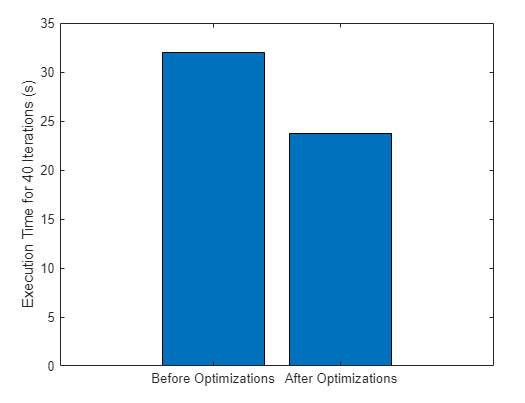
Compare the time to train for 40 iterations before and after making the changes to the training options and data.
figure
bar([trainnetTimeInit trainnetTimeOpt])
xticklabels(["Before Optimizations" "After Optimizations" "Loss Calculation"])
ylabel("Execution Time for 40 Iterations (s)")
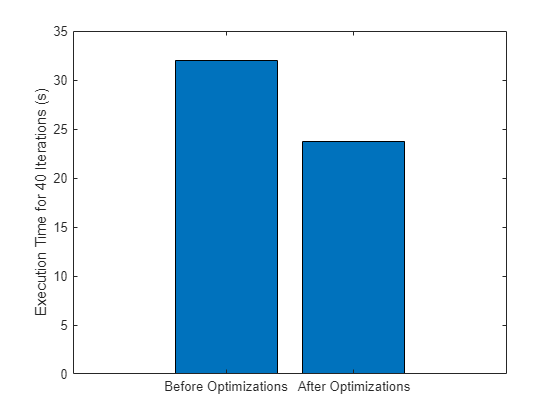
You can see that the optimizations have reduced the training time. When you apply the techniques described in this example to your own code, the performance improvement will strongly depend on your hardware and on the code you run.
Other Issues
This example focuses only on several aspects of training that you notice in the profile and then optimize. These are some other issues that you might notice when inspecting the profile of your training code.
Non-accelerated custom layers. If you have a custom layer that the
trainnetfunction is not able to accelerate, you might see that layer and the functions it calls in your profile. Wherever possible, make your custom layers acceleratable by inheriting fromnnet.layer.Acceleratable. For more information, see Custom Layer Function Acceleration.Sequence data of different lengths. If your training data contains sequences of different lengths, the software cannot cache and reuse traces to accelerate training. This can be visible in the profile as the functions called by
computeIterationrepresented by blue bars (like the bars labeledget_tp...in the profiles above) will be more numerous. Wherever possible, pad your sequence training data to the same length.Remote training data. If your data is in a different location to your training hardware, then this will result in significant communication overhead, which can be visible in the data loading parts of the profile. If you have sufficient memory, copy the data locally for best training speed.
References
[1] The TensorFlow Team. "Flowers" https://www.tensorflow.org/datasets/catalog/tf_flowers.
See Also
Profiler | trainingOptions | trainnet