equityCurve
Plot equity curves of strategies
Description
equityCurve( plots the equity
curves of each strategy that you create using backtester)backtestStrategy. After creating
the backtesting engine using backtestEngine and running the
backtest with runBacktest, use
equityCurve to plot the strategies and compare their
performance.
h = equityCurve(ax,backtester)h for the equity curve
plot.
Examples
The MATLAB® backtesting engine runs backtests of portfolio investment strategies over time series of asset price data. After creating a set of backtest strategies using backtestStrategy and the backtesting engine using backtestEngine, the runBacktest function executes the backtest. After using the runBacktest function to test investment strategies, you can run the equityCurve function to plot the equity curves of strategies.
Load Data
Load one year of stock price data. For readability, this example uses only a subset of the DJIA stocks.
% Read a table of daily adjusted close prices for 2006 DJIA stocks
T = readtable('dowPortfolio.xlsx');

% Prune the table to hold only the dates and selected stocks
timeColumn = "Dates";
assetSymbols = ["BA", "CAT", "DIS", "GE", "IBM", "MCD", "MSFT"];
T = T(:,[timeColumn assetSymbols]);

% Convert to timetable
pricesTT = table2timetable(T,'RowTimes','Dates');

% View the final asset price timetable
head(pricesTT)
       Dates        BA       CAT      DIS      GE       IBM      MCD     MSFT
    ___________    _____    _____    _____    _____    _____    _____    _____

    03-Jan-2006    68.63    55.86    24.18     33.6    80.13    32.72    26.19
    04-Jan-2006    69.34    57.29    23.77    33.56    80.03    33.01    26.32
    05-Jan-2006    68.53    57.29    24.19    33.47    80.56    33.05    26.34
    06-Jan-2006    67.57    58.43    24.52     33.7    82.96    33.25    26.26
    09-Jan-2006    67.01    59.49    24.78    33.61    81.76    33.88    26.21
    10-Jan-2006    67.33    59.25    25.09    33.43     82.1    33.91    26.35
    11-Jan-2006     68.3    59.28    25.33    33.66    82.19     34.5    26.63
    12-Jan-2006     67.9    60.13    25.41    33.25    81.61    33.96    26.48
Create Strategy
Test an equal-weighted investment strategy. This strategy invests an equal portion of the available capital into each asset. This example does not describe how to create backtesting strategies. For more information on creating backtesting strategies, see backtestStrategy.
Set the RebalanceFrequency name-value argument to rebalance the portfolio every 60 days. This example does not use a lookback window to rebalance.
% Create the strategy
numAssets = size(pricesTT,2);
equalWeightsVector = ones(1,numAssets) / numAssets;
equalWeightsRebalanceFcn = @(~,~) equalWeightsVector;

ewStrategy = backtestStrategy("EqualWeighted",equalWeightsRebalanceFcn, ...
    'RebalanceFrequency',60, ...
    'LookbackWindow',0, ...
    'TransactionCosts',0.005, ...
    'InitialWeights',equalWeightsVector)
ewStrategy =
  backtestStrategy with properties:

                      Name: "EqualWeighted"
              RebalanceFcn: @(~,~)equalWeightsVector
        RebalanceFrequency: 60
          TransactionCosts: 0.0050
            LookbackWindow: 0
            InitialWeights: [0.1429 0.1429 0.1429 0.1429 0.1429 0.1429 0.1429]
             ManagementFee: 0
     ManagementFeeSchedule: 1y
            PerformanceFee: 0
    PerformanceFeeSchedule: 1y
         PerformanceHurdle: 0
                  UserData: [0×0 struct]
            EngineDataList: [0×0 string]
Run Backtest
Create a backtesting engine and run a backtest over a year of stock data. For more information on creating backtest engines, see backtestEngine.
% Create the backtesting engine. The backtesting engine properties that hold the
% results are initialized to empty.
backtester = backtestEngine(ewStrategy)
backtester =
  backtestEngine with properties:

               Strategies: [1×1 backtestStrategy]
             RiskFreeRate: 0
           CashBorrowRate: 0
          RatesConvention: "Annualized"
                    Basis: 0
    InitialPortfolioValue: 10000
           DateAdjustment: "Previous"
      PayExpensesFromCash: 0
                NumAssets: []
                  Returns: []
                Positions: []
                 Turnover: []
                  BuyCost: []
                 SellCost: []
         TransactionCosts: []
                     Fees: []
% Run the backtest. The empty properties are now populated with
% timetables of detailed backtest results.
backtester = runBacktest(backtester,pricesTT)
backtester =
  backtestEngine with properties:

               Strategies: [1×1 backtestStrategy]
             RiskFreeRate: 0
           CashBorrowRate: 0
          RatesConvention: "Annualized"
                    Basis: 0
    InitialPortfolioValue: 10000
           DateAdjustment: "Previous"
      PayExpensesFromCash: 0
                NumAssets: 7
                  Returns: [250×1 timetable]
                Positions: [1×1 struct]
                 Turnover: [250×1 timetable]
                  BuyCost: [250×1 timetable]
                 SellCost: [250×1 timetable]
         TransactionCosts: [1×1 struct]
                     Fees: [1×1 struct]
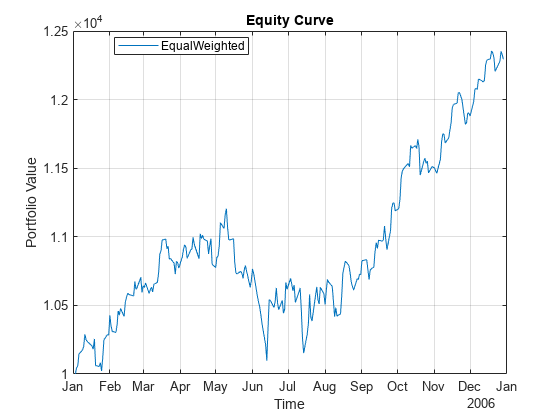
Generate Equity Curve
Use the equityCurve to plot the equity curve for the equal-weight strategy.
equityCurve(backtester)
Input Arguments
Output Arguments
Version History
Introduced in R2021a