绩效度量说明
使用三个金融时间序列对象,并结合以下各项的绩效数据,以便说明投资绩效度量的函数:
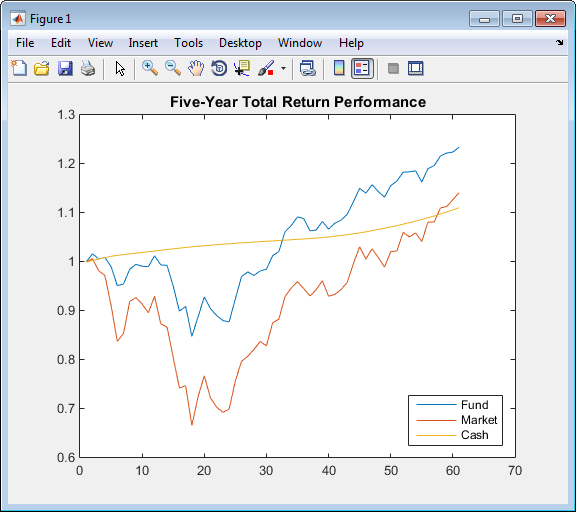
一个积极管理的大盘股价值共同基金
一个大盘市场指数
90 天期国库券
这些数据是覆盖五年期间的每月总收益价格。
下图说明在 5 年期开始时初始投资 1 美元后,每个序列的总收益绩效:
load FundMarketCash
plot(TestData)
hold on
title('\bfFive-Year Total Return Performance');
legend('Fund','Market','Cash','Location','SouthEast');
hold off
每个序列收益的均值 (Mean) 和标准差 (Sigma) 为
Returns = tick2ret(TestData);
Assets
Mean = mean(Returns)
Sigma = std(Returns, 1)
这得到以下结果:
Assets =
    'Fund'    'Market'    'Cash'
Mean =
    0.0038    0.0030    0.0017
Sigma =
    0.0229    0.0389    0.0009
另请参阅
sharpe | inforatio | portalpha | lpm | elpm | maxdrawdown | emaxdrawdown | ret2tick | tick2ret