Main Content

groupcounts

Number of group elements

Description

Table Data

example

G = groupcounts(T,groupvars) returns the unique grouping variable combinations for table or timetable T, the number of members in each group, and the percentage of the data each group represents in the range [0, 100]. Groups are defined by rows in the variables in groupvars that have the same unique combination of values. Each row of the output table corresponds to one group. For example, G = groupcounts(T,"HealthStatus") returns a table with the count and percentage of each group in the variable HealthStatus.

For more information, see Group Counts Computation.

example

G = groupcounts(T,groupvars,groupbins) specifies to bin rows in groupvars according to binning scheme groupbins prior to grouping. For example, G = groupcounts(T,"SaleDate","year") returns the group counts and group percentages for all sales in T within each year according to the grouping variable SaleDate.

example

G = groupcounts(___,Name,Value) specifies additional grouping properties using one or more name-value arguments for any of the previous syntaxes. For example, G = groupcounts(T,"Category1","IncludeMissingGroups",false) excludes the group made from missing data of type categorical indicated by <undefined> in Category1.

Array Data

B = groupcounts(A) returns the number of members in each group in vector, matrix, or cell array A. Groups are defined by rows in the column vectors in A that have the same unique combination of values. Each row of B contains the count for one group.

B = groupcounts(A,groupbins) specifies to bin the data according to binning scheme groupbins prior to grouping.

B = groupcounts(___,Name,Value) specifies additional grouping properties using one or more name-value arguments for either of the previous syntaxes for an input array.

example

[B,BG,BP] = groupcounts(A,___) returns additional group information. BG is the unique grouping vector combinations corresponding to the rows in B. BP is the percentage of the data each group count in B represents. The percentages are in the range [0, 100].

Examples

collapse all

Compute the number of elements in each group based on table data.

Create a table T that contains information about eight individuals.

HealthStatus = categorical(["Poor"; "Good"; "Fair"; "Fair"; "Poor"; "Excellent"; "Good"; "Excellent"]);
Smoker = logical([1; 0; 0; 1; 1; 0; 0; 1]);
Weight = [176; 153; 131; 133; 119; 120; 140; 129];
T = table(HealthStatus,Smoker,Weight)
T=8×3 table
    HealthStatus    Smoker    Weight
    ____________    ______    ______

     Poor           true       176  
     Good           false      153  
     Fair           false      131  
     Fair           true       133  
     Poor           true       119  
     Excellent      false      120  
     Good           false      140  
     Excellent      true       129  

Group the individuals by health status, and return the number of and percentage of individuals in each group.

G1 = groupcounts(T,"HealthStatus")
G1=4×3 table
    HealthStatus    GroupCount    Percent
    ____________    __________    _______

     Excellent          2           25   
     Fair               2           25   
     Good               2           25   
     Poor               2           25   

Group the individuals by health status and smoker status, and return the number of and percentage of individuals in each group. By default, groupcounts suppresses groups with zero elements, so some unique combinations of the grouping variable values are not returned.

G2 = groupcounts(T,["HealthStatus","Smoker"])
G2=6×4 table
    HealthStatus    Smoker    GroupCount    Percent
    ____________    ______    __________    _______

     Excellent      false         1          12.5  
     Excellent      true          1          12.5  
     Fair           false         1          12.5  
     Fair           true          1          12.5  
     Good           false         2            25  
     Poor           true          2            25  

To return a row for each group, including those with zero elements, specify IncludeEmptyGroups as true.

G3 = groupcounts(T,["HealthStatus","Smoker"],"IncludeEmptyGroups",true)
G3=8×4 table
    HealthStatus    Smoker    GroupCount    Percent
    ____________    ______    __________    _______

     Excellent      false         1          12.5  
     Excellent      true          1          12.5  
     Fair           false         1          12.5  
     Fair           true          1          12.5  
     Good           false         2            25  
     Good           true          0             0  
     Poor           false         0             0  
     Poor           true          2            25  

Group data according to specified bins.

Create a timetable containing sales information for days within a single month.

TimeStamps = datetime([2017 3 4; 2017 3 2; 2017 3 15; 2017 3 10; ...
                       2017 3 14; 2017 3 31; 2017 3 25; ...
                       2017 3 29; 2017 3 21; 2017 3 18]);
Profit = [2032 3071 1185 2587 1998 2899 3112 909 2619 3085]';
ItemsSold = [14 13 8 5 10 16 8 6 7 11]';
TT = timetable(TimeStamps,Profit,ItemsSold)
TT=10×2 timetable
    TimeStamps     Profit    ItemsSold
    ___________    ______    _________

    04-Mar-2017     2032        14    
    02-Mar-2017     3071        13    
    15-Mar-2017     1185         8    
    10-Mar-2017     2587         5    
    14-Mar-2017     1998        10    
    31-Mar-2017     2899        16    
    25-Mar-2017     3112         8    
    29-Mar-2017      909         6    
    21-Mar-2017     2619         7    
    18-Mar-2017     3085        11    

Compute the group counts by the total items sold, binning the groups into intervals of item numbers.

G = groupcounts(TT,"ItemsSold",[0 4 8 12 16])
G=3×3 table
    disc_ItemsSold    GroupCount    Percent
    ______________    __________    _______

       [4, 8)             3           30   
       [8, 12)            4           40   
       [12, 16]           3           30   

Compute the group counts binned by day of the week.

G = groupcounts(TT,"TimeStamps","dayname")
G=5×3 table
    dayname_TimeStamps    GroupCount    Percent
    __________________    __________    _______

        Tuesday               2           20   
        Wednesday             2           20   
        Thursday              1           10   
        Friday                2           20   
        Saturday              3           30   

Determine which elements in a vector appear more than once.

Create a column vector with values between 1 and 5.

A = [1 1 2 2 3 5 3 3 1 4]';

Determine the unique groups in the vector and count the group members.

[B,BG] = groupcounts(A)
B = 5×1

     3
     2
     3
     1
     1

BG = 5×1

     1
     2
     3
     4
     5

Determine which elements in the vector appear more than once by creating a logical index for the groups with a count larger than 1. Index into the groups to return the vector elements that are duplicated.

duplicates = BG(B > 1)
duplicates = 3×1

     1
     2
     3

Compute the group counts for a set of people grouped by their health status and smoker status.

Store information about eight individuals as three vectors of different types.

HealthStatus = categorical(["Poor"; "Good"; "Fair"; "Fair"; "Poor"; "Excellent"; "Good"; "Excellent"]);
Smoker = logical([1; 0; 0; 1; 1; 0; 0; 1]);
Weight = [176; 153; 131; 133; 119; 120; 140; 129];

Grouping by health status and smoker status, compute the group counts. Specify three outputs to also return the groups BG and group count percentages BP.

BG is a cell array containing two vectors that describe the groups as you look at their elements row-wise. For instance, the first row of BG{1} indicates that the individuals in the first group have a health status Excellent, and the first row of BG{2} indicates that they are nonsmokers. Finally, BP contains the percentage of members in each group for the corresponding groups in BG.

[B,BG,BP] = groupcounts({HealthStatus,Smoker},"IncludeEmptyGroups",true);
B
B = 8×1

     1
     1
     1
     1
     2
     0
     0
     2

BG{1}
ans = 8x1 categorical
     Excellent 
     Excellent 
     Fair 
     Fair 
     Good 
     Good 
     Poor 
     Poor 

BG{2}
ans = 8x1 logical array

   0
   1
   0
   1
   0
   1
   0
   1

BP
BP = 8×1

   12.5000
   12.5000
   12.5000
   12.5000
   25.0000
         0
         0
   25.0000

Input Arguments

collapse all

Input table, specified as a table or timetable.

Input array, specified as a column vector, group of column vectors stored as a matrix, or cell array of column vectors, character row vectors, or matrices.

Grouping variables or vectors, specified as one of the options in this table. For table or timetable input data, groupvars indicates which variables to use to compute groups in the data. Other variables not specified by groupvars are not operated on and do not pass through to the output.

Indexing SchemeExamples

Variable names:

  • A string or character vector

  • A string array or cell array of character vectors

  • A pattern object

  • "A" or 'A' — A variable named A

  • ["A" "B"] or {'A','B'} — Two variables named A and B

  • "Var"+digitsPattern(1) — Variables named "Var" followed by a single digit

Variable index:

  • An index number that refers to the location of a variable in the table

  • A vector of numbers

  • A logical vector. Typically, this vector is the same length as the number of variables, but you can omit trailing 0 or false values.

  • 3 — The third variable from the table

  • [2 3] — The second and third variables from the table

  • [false false true] — The third variable

Function handle:

  • A function handle that takes a table variable as input and returns a logical scalar

  • @isnumeric — All the variables containing numeric values

Variable type:

  • A vartype subscript that selects variables of a specified type

  • vartype("numeric") — All the variables containing numeric values

Example: groupcounts(T,"Var3")

Binning scheme for grouping variables or vectors, specified as one or more of the following binning methods. Grouping variables or vectors and binning scheme arguments must be the same size, or one of them can be scalar.

  • "none" — No binning.

  • Vector of bin edges — The bin edges define the bins. You can specify the edges as numeric values or as datetime values for datetime grouping variables or vectors.

  • Number of bins — The number determines how many equally spaced bins to create. You can specify the number of bins as a positive integer scalar.

  • Length of time (bin width) — The length of time determines the width of each bin. You can specify the bin width as a duration or calendarDuration scalar for datetime or duration grouping variables or vectors.

  • Name of time unit (bin width) — The name of the time unit determines the width of each bin. You can specify the bin width as one of the options in this table for datetime or duration grouping variables or vectors.

    ValueDescriptionData Type
    "second"

    Each bin is 1 second.

    datetime and duration
    "minute"

    Each bin is 1 minute.

    datetime and duration
    "hour"

    Each bin is 1 hour.

    datetime and duration
    "day"

    Each bin is 1 calendar day. This value accounts for daylight saving time shifts.

    datetime and duration
    "week"Each bin is 1 calendar week.datetime only
    "month"Each bin is 1 calendar month.datetime only
    "quarter"Each bin is 1 calendar quarter.datetime only
    "year"

    Each bin is 1 calendar year. This value accounts for leap days.

    datetime and duration
    "decade"Each bin is 1 decade (10 calendar years).datetime only
    "century"Each bin is 1 century (100 calendar years).datetime only
    "secondofminute"

    Bins are seconds from 0 to 59.

    datetime only
    "minuteofhour"

    Bins are minutes from 0 to 59.

    datetime only
    "hourofday"

    Bins are hours from 0 to 23.

    datetime only
    "dayofweek"

    Bins are days from 1 to 7. The first day of the week is Sunday.

    datetime only
    "dayname"Bins are full day names, such as "Sunday".datetime only
    "dayofmonth"Bins are days from 1 to 31.datetime only
    "dayofyear"Bins are days from 1 to 366.datetime only
    "weekofmonth"Bins are weeks from 1 to 6.datetime only
    "weekofyear"Bins are weeks from 1 to 54.datetime only
    "monthname"Bins are full month names, such as "January".datetime only
    "monthofyear"

    Bins are months from 1 to 12.

    datetime only
    "quarterofyear"Bins are quarters from 1 to 4.datetime only

Example: G = groupcounts(T,"Var1",[-Inf 0 Inf])

Example: G = groupcounts(T,["Var1" "Var2"],{"none" "year"})

Name-Value Arguments

Specify optional pairs of arguments as Name1=Value1,...,NameN=ValueN, where Name is the argument name and Value is the corresponding value. Name-value arguments must appear after other arguments, but the order of the pairs does not matter.

Example: G = groupcounts(T,groupvars,groupbins,IncludedEdge="right")

Before R2021a, use commas to separate each name and value, and enclose Name in quotes.

Example: G = groupcounts(T,groupvars,groupbins,"IncludedEdge","right")

Included bin edge for binning scheme, specified as either "left" or "right", indicating which end of the bin interval is inclusive.

You can specify IncludedEdge only if you also specify groupbins, and the value applies to all binning methods for all grouping variables or vectors.

Option to treat missing values as a group, specified as a numeric or logical 1 (true) or 0 (false). If IncludeMissingGroups is true, then groupcounts treats missing values, such as NaN, in a grouping variable or vector as a group. If a grouping variable or vector has no missing values, or if IncludeMissingGroups is false, then groupcounts does not treat missing values as a group.

Option to include empty groups in the group counts operation, specified as a numeric or logical 0 (false) or 1 (true). If IncludeEmptyGroups is false, then groupcounts omits empty groups. If IncludeEmptyGroups is true, then groupcounts includes empty groups.

An empty group occurs in these cases:

  • A possible value of a grouping variable or vector is not represented in the input data, such as in a categorical, logical, or binned numeric variable or vector. For example, if no row in the input table has a value of true for a logical grouping variable, then true defines an empty group.

  • A unique combination of grouping variables or vectors is not represented in the input data. For example, if there is no row in the input table where the value of grouping variable A is A1 and the value of grouping variable B is B1, then A1_B1 defines an empty group.

Output Arguments

collapse all

Output table for table or timetable input data, returned as a table. G contains the computed groups, number of elements in each group, and percentages represented by each group count. For a single grouping variable, the output groups are sorted according to the order returned by the unique function with the "sorted" option.

Group counts for array input data, returned as a column vector. B contains the number of elements in each group.

Groups for array input data, returned as a column vector or cell array of column vectors. For a single grouping vector, the output groups are sorted according to the order returned by the unique function with the "sorted" option.

For more than one input vector, BG is a cell array containing column vectors of equal length. Information for each group is contained in the elements of a row across all vectors in BG. Each group maps to the corresponding row of the output array B.

Group count percentages for array input data, returned as a column vector. BP contains a percentage in the range [0, 100] for each group in B.

More About

collapse all

Group Counts Computation

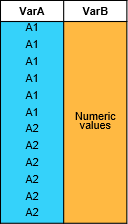
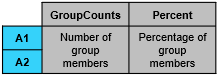
This table illustrates group counts computations.

Sample Table TSyntax ExampleResulting Table

Input table containing categorical variable VarA and numeric variable VarB

groupcounts(T,"VarA")

Output table where the row names are the categories of VarA and the variables are the number and percentage of group members

groupcounts(T,["VarA" "VarB"],{"none",[-Inf 0 Inf]})

Output table where the row names are the combinations of categories of VarA and bins of VarB, and the variables are the number and percentage of group members

Tips

  • When making many calls to groupcounts, consider converting grouping variables to type categorical or logical when possible for improved performance. For example, if you have a string array grouping variable (such as HealthStatus with elements "Poor", "Fair", "Good", and "Excellent"), you can convert it to a categorical variable using the command categorical(HealthStatus).

Extended Capabilities

Version History

Introduced in R2019a

expand all