Main Content

xcorr

R2026b

Cross-correlation

Description

r = xcorr(x,y) returns the cross-correlation of two discrete-time sequences. Cross-correlation measures the similarity between a vector x and shifted (lagged) copies of a vector y as a function of the lag. If x and y have different lengths, the function appends zeros to the end of the shorter vector so it has the same length as the other.

example

r = xcorr(x) returns the autocorrelation sequence of x. If x is a matrix, then r is a matrix whose columns contain the autocorrelation and cross-correlation sequences for all combinations of the columns of x.

example

r = xcorr(___,maxlag) limits the lag range from -maxlag to maxlag for either of the previous syntaxes.

example

r = xcorr(___,scaleopt) also specifies a normalization option for the cross-correlation or autocorrelation. Any option other than "none" (the default) requires x and y to have the same length.

example

r = xcorr(___,LagSelection=range) specifies whether to return the cross-correlation for only nonnegative lags, only nonpositive lags, or all lags. (since R2026b)

example

[r,lags] = xcorr(___) also returns the lags at which the correlations are computed.

example

Examples

collapse all

Create a vector x and a vector y that is equal to x shifted by 5 elements to the right. Compute and plot the estimated cross-correlation of x and y. The largest spike occurs at the lag value when the elements of x and y match exactly (-5).

n = 0:15;
x = 0.84.^n;
y = circshift(x,5);
[c,lags] = xcorr(x,y);
stem(lags,c)
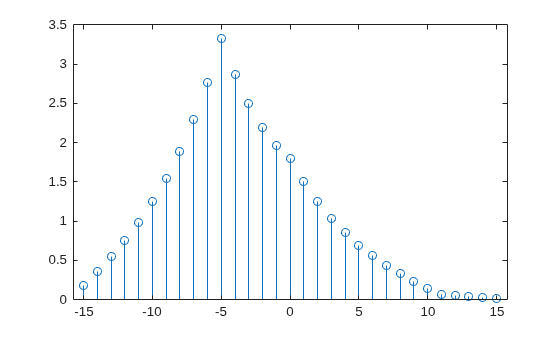
Figure contains an axes object. The axes object contains an object of type stem.

Compute and plot the estimated autocorrelation of a vector x. The largest spike occurs at zero lag, when x matches itself exactly.

n = 0:15;
x = 0.84.^n;
[c,lags] = xcorr(x);
stem(lags,c)
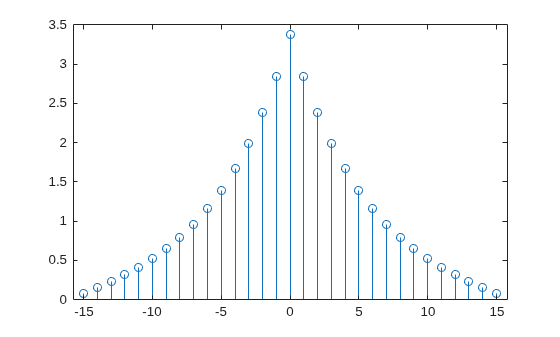
Figure contains an axes object. The axes object contains an object of type stem.

Compute and plot the normalized cross-correlation of vectors x and y with unity peak, and specify a maximum lag of 10.

n = 0:15;
x = 0.84.^n;
y = circshift(x,5);
[c,lags] = xcorr(x,y,10,'normalized');
stem(lags,c)
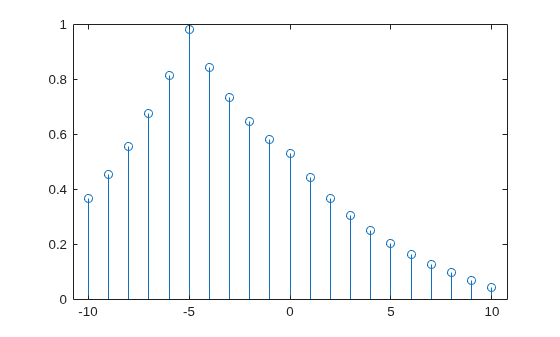
Figure contains an axes object. The axes object contains an object of type stem.

Create two signals where y is a delayed copy of x, and use cross-correlation to determine the delay.

x = [1 0 0 0 0];
y = [0 0 0 1 0];

In the cross-correlation of x and y, a negative lag means y is delayed relative to x, and a positive lag means x is delayed relative to y.

If you know that y is delayed relative to x, the peak cross-correlation must be at a negative lag. Specify LagSelection="nonpositive" to return only the nonpositive lags.

[c,lags] = xcorr(x,y,LagSelection="nonpositive")
c = 1×5

         0    1.0000         0   -0.0000         0

lags = 1×5

    -4    -3    -2    -1     0

Determine the delay between the signals by finding the lag at the peak of the cross-correlation. The result indicates that y lags 3 samples behind x.

[~,idx] = max(c);
delay = lags(idx)
delay = 
-3

Input Arguments

collapse all

Input array, specified as a vector, matrix, or multidimensional array. If x is a multidimensional array, then xcorr operates column-wise across all dimensions and returns each autocorrelation and cross-correlation as the columns of a matrix.

The input array x can be a sparse matrix or vector of type double or single. (since R2026b)

Data Types: double | single
Complex Number Support: Yes

Input array, specified as a vector.

The input array y can be a sparse vector of type double or single. (since R2026b)

Data Types: double | single
Complex Number Support: Yes

Maximum lag, specified as an integer scalar. The maximum lag is the farthest number of samples that xcorr shifts one input sequence relative to the other. If you specify maxlag, xcorr computes the cross-correlation for lags from -maxlag to maxlag. If you do not specify maxlag, the default maximum lag is N - 1, where N is the greater of the lengths of x and y, and xcorr computes the cross-correlation for lags from -(N - 1) to N - 1.

Data Types: single | double

Normalization option, specified as one of the following.

  • "none" — Raw, unscaled cross-correlation. "none" is the only valid option when x and y have different lengths.

  • "biased" — Biased estimate of the cross-correlation:

    R^xy,biased(m)=1NR^xy(m).

  • "unbiased" — Unbiased estimate of the cross-correlation:

    R^xy,unbiased(m)=1N|m|R^xy(m).

  • "normalized" or "coeff" — Normalizes the sequence so that the autocorrelations at zero lag equal 1:

    R^xy,coeff(m)=1R^xx(0)R^yy(0)R^xy(m).

Since R2026b

Selection of lags to include in the output, specified as one of these values:

  • "all" — Return the cross-correlation for all lags from -maxlag to maxlag.

  • "nonnegative" — Return the cross-correlation for nonnegative lags only, from 0 to maxlag.

  • "nonpositive" — Return the cross-correlation for nonpositive lags only, from -maxlag to 0.

Output Arguments

collapse all

Cross-correlation or autocorrelation, returned as a vector or matrix.

If x is an M × N matrix, then xcorr(x) returns a (2M – 1) × N2 matrix with the autocorrelations and cross-correlations of the columns of x. If you specify maxlag, then r has size (2 × maxlag + 1) × N2.

If you specify LagSelection as "nonnegative" or "nonpositive", then r has maxlag + 1 rows instead of 2 x maxlag + 1 rows.

For example, if S has three columns, S=(x1x2x3), then the result of R = xcorr(S) is organized as

R=(Rx1x1Rx1x2Rx1x3Rx2x1Rx2x2Rx2x3Rx3x1Rx3x2Rx3x3).

Lag indices, returned as a vector.

More About

collapse all

References

[1] Buck, John R., Michael M. Daniel, and Andrew C. Singer. Computer Explorations in Signals and Systems Using MATLAB®. 2nd Edition. Upper Saddle River, NJ: Prentice Hall, 2002.

[2] Stoica, Petre, and Randolph Moses. Spectral Analysis of Signals. Upper Saddle River, NJ: Prentice Hall, 2005.

Extended Capabilities

expand all

Version History

Introduced before R2006a

expand all

See Also

| | |