Initialize Feature and Calibration Tables
If you import your strategy with lookup tables already initialized, you do not need to initialize your lookup tables. Use the Feature Fill Wizard to fill your lookup tables. For more information, see Fill Feature Lookup Tables.
You can use the Calibration Manager to import lookup table values from external sources and set the size of lookup tables and normalizers. For more information, see Calibration Manager.
Initialize a Feature
You can initialize a feature to set the values of the normalizers over the variable range and put specified values into each lookup table cell. A lookup table that is already initialized provides a useful starting point for a more detailed calibration.
For example, a simple feature for maximum brake torque (MBT) consists of the following lookup tables:
Speed (N), load (L) lookup table
A lookup table to account for the behavior of air/fuel ratio (A)
Initializing this feature sets the values of the normalizers for speed, load, and AFR over the variable ranges and puts specified values into each lookup table cell.
To initialize the feature, perform these steps:
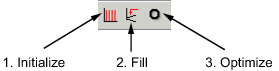
Click
 to open the Feature Initialization Options
dialog box.
to open the Feature Initialization Options
dialog box.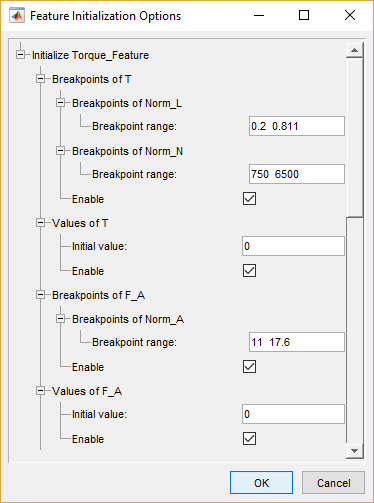
Enter the ranges for the breakpoints in your normalizers.
L has range
0.2to0.811.N has range
750to6500.A has range
11to17.6.
Enter the initial lookup table value for each cell in each lookup table. Above, the cell values are
Table T has initial value
0.Table F_A has initial value
0.
Click OK to initialize the feature.
Initialize Breakpoints
You can initialize normalizer breakpoints individually, or initialize the whole feature. Initialization places the breakpoints at even intervals along the range of the variable defined for the normalizer. When you add a lookup table and specify the inputs in the Table Setup dialog box, CAGE initializes the table normalizers by spacing the breakpoints evenly over the input variable ranges. If you have edited breakpoints, you can return to even spacing by using the Initialize function.
To space the breakpoints evenly:
Click
 on the toolbar or select Normalizer > Initialize.
In the dialog box, enter the range of values for the normalizer.
Click OK.
For example, for a torque table with two normalizers of engine speed and load, you can
evenly space the normalizer breakpoints over the range between 500 and 6500 rpm for
speed and between 0.1 and 1 for relative air charge. In the dialog box, enter
500 6500 for the speed normalizer, N, and
0.1 1 for the load normalizer, L.
Initialize Table Values
You can initialize tables individually or initialize the whole feature. Initializing table values sets the value of every cell in the selected table to a constant.
To initialize the table values:
Click
 or select Table > Initialize.
Select the constant value that you want to insert into each cell.
Considerations:
Filling with zeros can cause a problem for some strategies that use modifier tables. For example, your strategy might use several speed-load tables for different values of AFR. The strategy might use an AFR table as a modifier to add to a single speed-load table to adjust for the effects of different AFR levels on your torque output.
If the strategy uses modifier tables that are multipliers, avoid initializing the modifier tables with zeros. Initialization can result in division by zero failures.
If the table is a modifier that is added to other tables, initially fill it with zeros.
If the table is a modifier that multiplies other tables, fill it with ones.
Optimize Normalizer Breakpoints
You can use CAGE to space the breakpoints over the range of normalizers. Select a normalizer in the tree display.
To space the breakpoints, either click the buttons on the toolbar or select from the following options on the Normalizer menu.
Normalizer | Description |
|---|---|
Initialize | Spaces the breakpoints evenly along the normalizer. |
Fill | Spaces the breakpoints by reference to the model. For example, you can place most breakpoints where the model curvature is the greatest. |
Optimize | Moves the breakpoints to minimize the least square error over the range of the axis. To optimize normalizers, each normalizer must have a single variable input that is an input to the model. For 2-D tables, the single variable input must be different from the other normalizer input. Only available when you are performing Feature calibrations. |
Optimize Breakpoints
Optimizing breakpoints spaces the breakpoints by reference to the model.
For example, suppose a model of the spark angle that produces the maximum brake torque (MBT) has these inputs: engine speed N, relative air charge L, and air-to-fuel ratio A. You can space the breakpoints for engine speed and relative air charge over the range of these variables by referring to the model.
To space the breakpoints based on model curvature, complete these steps:
Click
 or select Normalizer > Fill.
The Breakpoint Fill Options dialog box opens.
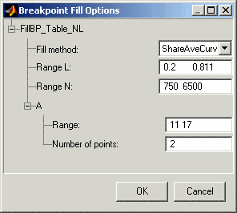
Choose the appropriate method to space your breakpoints, from the drop-down menu in the dialog box.
Enter the ranges of the values for the normalizers.
The preceding example shows Range N
500 6500, and Range L,0.1 1.Enter the ranges of the other model variables.
CAGE spaces the breakpoints by reference to the model at selected points. The example shows
11 17for the Range of A and2for the Number of points. This takes two slices through the model at A = 11 and A = 17. Each slice is a surface in N and L. That is, MBT(N, L, 11) and MBT(N, L, 17).CAGE computes the average value of these two surfaces to give an average model MBTAV(N, L).
If you set Number of points to one, and specify a range, then the mean of the range is chosen as the evaluation point.
Click OK.
If any of the breakpoints is locked, each group of unlocked breakpoints is independently spaced according to the selected algorithm.
If you increase the number of slices through the model, you increase the computing time required to calculate where to place the breakpoints.
To optimize the breakpoints, complete these steps:
Ensure that the optimization routine works over reasonable values for the table by choosing one of these methods:
Select Normalizer > Initialize.
Select Normalizer > Fill.
Click
 on the toolbar or select Normalizer > Optimize.
This opens the following dialog box.
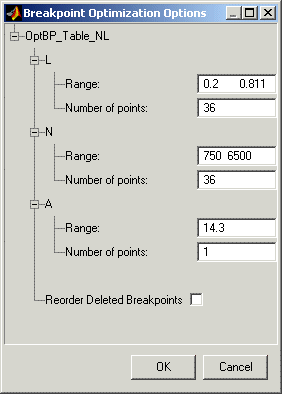
Enter the ranges for the normalizers.
The example shows
0.2 0.811for the Range of L, and750 6500for N.Enter the appropriate number of grid points for the optimization.
This defines a grid over which the optimization works. In the preceding example, the number of grid points is
36for both L and N. This mesh is combined using cubic splines to approximate the model.Enter ranges and numbers of points for the other model variables.
The example shows a Range of A of
14.3and the Number of points is1.Decide whether to reorder deleted breakpoints by clicking the option button.
If you choose to reorder deleted breakpoints, the optimization process might redistribute them between other undeleted breakpoints.
Click OK.
CAGE calculates the table filled with the mesh at the current breakpoints. Then CAGE calculates the total square error between the table values and the mesh model.
The breakpoints are adjusted until this error is minimized, using nonlinear least squares optimization.
When optimizing the breakpoints, the default:
Range for the normalizer variable is the range of the variable.
Value for all other model variables is the set point of the variable.
Number of grid points is three times the number of breakpoints.