factorPoseSE2AndPointXY
Description
The factorPoseSE2AndPointXY object contains factors that each describe the
relationship between a position in the SE(2) state space and a 2-D landmark point. You can use
this object to add one or more factors to a factorGraph
object.
Creation
Description
F = factorPoseSE2AndPointXY(nodeID)factorPoseSE2AndPointXY object, F, with
the node identification numbers property NodeID set to
nodeID.
F = factorPoseSE2AndPointXY(___,Name=Value)factorPoseSE2AndPointXY([1
2],Measurement=[1 5]) sets the Measurement property of
the factorPoseSE2AndPointXY object to [1 5].
Properties
Object Functions
nodeType | Get node type of node in factor graph |
Examples
Create a matrix of positions of the landmarks to use for localization, and the real poses of the robot to compare your factor graph estimate against. Use the exampleHelperPlotGroundTruth helper function to visualize the landmark points and the real path of the robot.
gndtruth = [0 0 0;
            2 0 pi/2;
            2 2 pi;
            0 2 pi];
landmarks = [3 0; 0 3];
exampleHelperPlotGroundTruth(gndtruth,landmarks)
Use the exampleHelperSimpleFourPoseGraph helper function to create a factor graph contains four poses related by three 2-D two-pose factors. For more details, see the factorTwoPoseSE2 object page.
fg = exampleHelperSimpleFourPoseGraph(gndtruth);
Create Landmark Factors
Generate node IDs to create two node IDs for two landmarks. The second and third pose nodes observe the first landmark point so they should connect to that landmark with a factor. The third and fourth pose nodes observe the second landmark.
lmIDs = generateNodeID(fg,2);
lmFIDs = [1 lmIDs(1);  % Pose Node 1 <-> Landmark 1
          2 lmIDs(1);  % Pose Node 2 <-> Landmark 1
          2 lmIDs(2);  % Pose Node 2 <-> Landmark 2
          3 lmIDs(2)]; % Pose Node 3 <-> Landmark 2
Define the relative position measurements between the position of the poses and their landmarks in the reference frame of the pose node. Then add some noise.
lmFMeasure = [0  -1; % Landmark 1 in pose node 1 reference frame
             -1   2; % Landmark 1 in pose node 2 reference frame
              2  -1; % Landmark 2 in pose node 2 reference frame
              0  -1]; % Landmark 2 in pose node 3 reference frame
lmFMeasure = lmFMeasure + 0.1*rand(4,2);
Create the landmark factors with those relative measurements and add it to the factor graph.
lmFactor = factorPoseSE2AndPointXY(lmFIDs,Measurement=lmFMeasure);
addFactor(fg,lmFactor);
Set the initial state of the landmark nodes to the real position of the landmarks with some noise.
nodeState(fg,lmIDs,landmarks+0.1*rand(2));
Optimize Factor Graph
Optimize the factor graph with the default solver options. The optimization updates the states of all nodes in the factor graph, so the positions of vehicle and the landmarks update.
rng default
optimize(fg)
ans = struct with fields:
InitialCost: 0.0538
FinalCost: 6.2053e-04
NumSuccessfulSteps: 4
NumUnsuccessfulSteps: 0
TotalTime: 1.5092e-04
TerminationType: 0
IsSolutionUsable: 1
OptimizedNodeIDs: [1 2 3 4 5]
FixedNodeIDs: 0
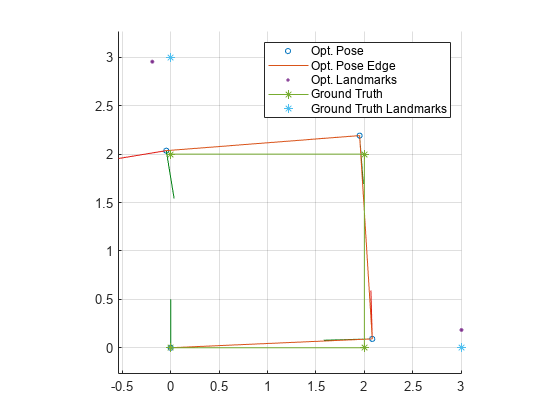
Visualize and Compare Results
Get and store the updated node states for the robot and landmarks. Then plot the results, comparing the factor graph estimate of the robot path to the known ground truth of the robot.
poseIDs = nodeIDs(fg,NodeType="POSE_SE2")poseIDs = 1×4
0 1 2 3
poseStatesOpt = nodeState(fg,poseIDs)
poseStatesOpt = 4×3

         0         0         0
    2.0815    0.0913    1.5986
    1.9509    2.1910   -3.0651
   -0.0457    2.0354   -2.9792
landmarkStatesOpt = nodeState(fg,lmIDs)
landmarkStatesOpt = 2×2

    3.0031    0.1844
   -0.1893    2.9547
handle = show(fg,Orientation="on",OrientationFrameSize=0.5,Legend="on");
grid on;
hold on;
exampleHelperPlotGroundTruth(gndtruth,landmarks,handle);