plotMonotonicity
Description
The plotMonotonicity function plots a polygon specified as a
polyshape object, and its monotonic intervals. The concave regions of a
polyshape determine where the polygon is monotonic, so
plotMonotonicity displays these intervals, offset by positive 90
degrees, so that they align with the concave regions that define them. This alignment helps
clarify how the geometry of the polygon influences its monotonicity.
Visualizing monotonicity is especially helpful when planning sweep-based coverage of
regions using the polygonSweep function. In a sweep, the sweep direction
refers to the direction of motion, while the sweep lines are oriented positive 90 degrees from
that direction. Because plotMonotonicity displays the monotonic intervals
with this same positive 90° offset, you can interpret the plotted intervals as the valid
sweep-line angles. Then, you can infer the corresponding valid sweep angles and directions.
The figure illustrates how these intervals relate to the sweep angles and the resulting sweep
path, assuming a back-and-forth (boustrophedon) pattern.
For more information about polygon monotonicity, see the Monotonicity section of the
polygonMonotonicity function.
plotMonotonicity( plots the specified
polygon and the first monotonic interval within a concave region of it.poly)
plotMonotonicity(
specifies plot options using one or more name-value arguments. For example
poly,Name=Value)Intervals="all" plots all of the monotonic intervals for each region of
the polygon.
hVis = plotMonotonicity(___)
Examples
Define the geometry of a polygon as a polyshape object.
poly = polyshape([0 0 1.5 3 3 1.875 1.5 1.1250 0],[0 2 1.5 2 0 0 0.5 0 0]);
Check if any regions of the polygon are monotonic, and return the monotonic angle intervals for those regions.
[isMono,intervals] = polygonMonotonicity(poly);
Plot the monotonic intervals of the polygon.
hVis = plotMonotonicity(poly);
axis equal tight
title(["Polygon and Corresponding","Monotonic Intervals"])
legend("Polygon","Monotonic Intervals",Location="northeastoutside")
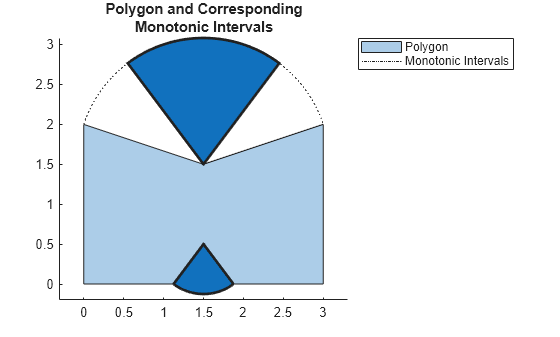
You can use these monotonic intervals to plan sweep paths. Sweeping in a monotonic interval ensures that you can fully sweep the corresponding region of a polygon in one direction, without needing to backtrack.
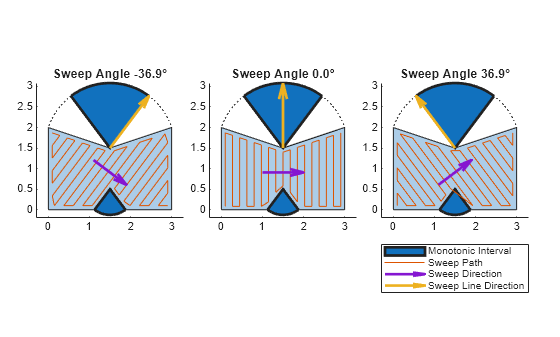
Store three sweep angles from within the first monotonic angle interval.
sweepAngles = [intervals(1,1) mean(intervals(1,:)) intervals(1,2)] - pi;
Define the geometry of the sweep tool. In this case, assume the tool is shaped like a regular pentagon.
tool = nsidedpoly(5,Radius=0.1);
Set up three subplots, for showing the sweep paths along the selected sweep angles.
t = tiledlayout(1,3,Padding="compact",TileSpacing="compact");
Generate and plot a sweep path for each of the stored sweep angles. Plot the sweep direction arrow and sweep line direction arrow to show their relationships to the sweep angle and path.
for i = 1:3
opts = polysweepoptsbous(SweepAngle=sweepAngles(i),BoundaryBehavior="inset",SweepToolGeometry=tool);
path = polygonSweep(poly,opts);

nexttile

hVis = plotMonotonicity(poly);

hold on
axis equal tight

% Plot the swept path
pathHandle = plot(path(:,1),path(:,2));

% Plot the sweep direction arrow and sweep line direction arrows to
% show their relationships to the sweep angle and path.
sweepLineDirHandle = exampleHelperHighlightInterval(hVis,sweepAngles(i)+pi/2);
sweepDirHandle = exampleHelperPlotSweepDirection(poly,sweepAngles(i));

% Add a title to the current tile
title("Sweep Angle " + num2str(rad2deg(sweepAngles(i)),"%.1f") + "°");

hold off
end

handles = [hVis.MonotoneIntervals.Children(1), ...
           pathHandle, ...
           sweepDirHandle, ...
           sweepLineDirHandle];

legend(handles,{"Monotonic Interval","Sweep Path","Sweep Direction","Sweep Line Direction"},Location="southoutside",Orientation="vertical");
Input Arguments
Name-Value Arguments
Output Arguments
Version History
Introduced in R2026a