Generate a MATLAB Function in Diagnostic Feature Designer
In Diagnostic Feature Designer, you explore features interactively, using tools for signal processing, feature generation, and ranking. Once you select the set of the features that perform best, you can generate a MATLAB® function that reproduces the calculations for those features. You can apply this function directly to a larger set of measurement data and increase the number of members in your feature set. You can also modify the function to suit your application, and incorporate part or all of the function into other code.
This example shows how to generate a MATLAB function to compute a set of features, and how to validate that function with the original data set.
The example assumes that you are familiar with ensemble data concepts and with basic operations in the app, such as data import, signal processing, and feature generation. For more information on these concepts and operations, see Design Condition Indicators for Predictive Maintenance Algorithms.
Import the Transmission Model Data
This example uses ensemble data generated from a transmission system model in Using Simulink to Generate Fault Data. Outputs of the model include:
Vibration measurements from a sensor monitoring casing vibrations
Tachometer sensor, which issues a pulse every time the shaft completes a rotation
Fault code indicating the presence of a modeled fault
In your MATLAB command window, load the transmission data, which is stored in the table
dataTable.
load dfd_Tutorial dataTable
dataTable
is an ensemble table that contains 16 members, each of which represents one simulated
transmission system. Each row of the table corresponds to one member. Each column of the
table corresponds to one variable, such as Vibration or
FaultCode. All ensemble members have the same variables.Open Diagnostic Feature Designer.
diagnosticFeatureDesigner
In the app, import dataTable. During the import process, set the
faultCode type to a condition variable. When the import is complete,
the Signals list in the Variables pane displays
the vibration and tacho data. For information on the import process, see Import and Visualize Ensemble Data in Diagnostic Feature Designer.

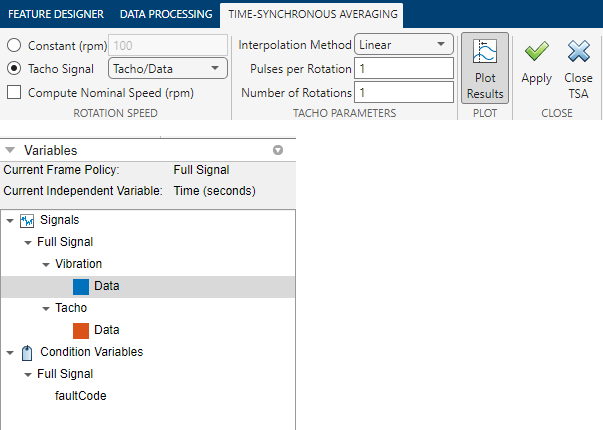
Compute a TSA Signal
Compute a time-synchronous average (TSA) signal from your vibration and tacho signals.
To do so, first select Vibration/Data in the
Variables pane. Then, in the Feature Designer
tab, select Filtering & Averaging > Time-Synchronous Averaging. Set the parameters as shown in the following figure and click
OK.
The new signal appears in the Variables pane.
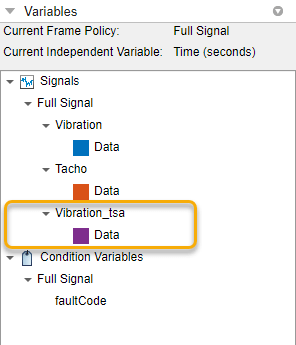
For information on TSA signals, see tsa.
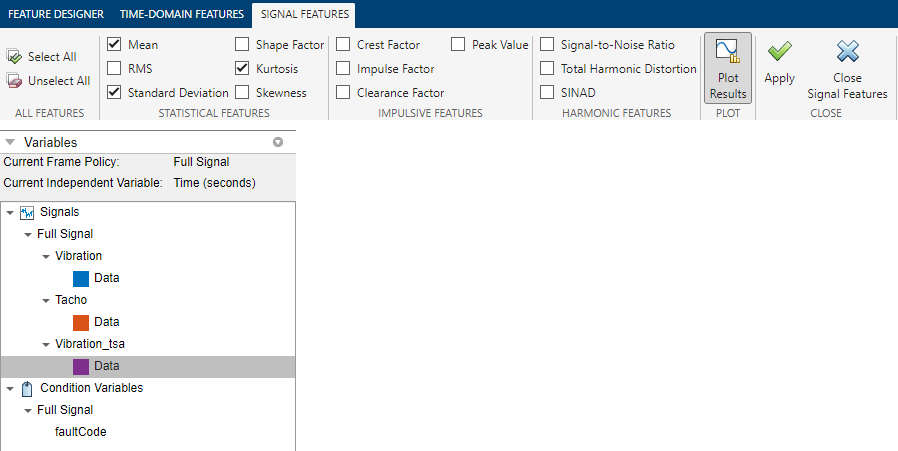
Extract Features from the TSA Signal
In the Variables pane, select the TSA signal. Then, in the Feature Designer tab, select Time-Domain Features > Signal Features to open the set of available signal features. Select the features for Mean, Standard Deviation, and Kurtosis.
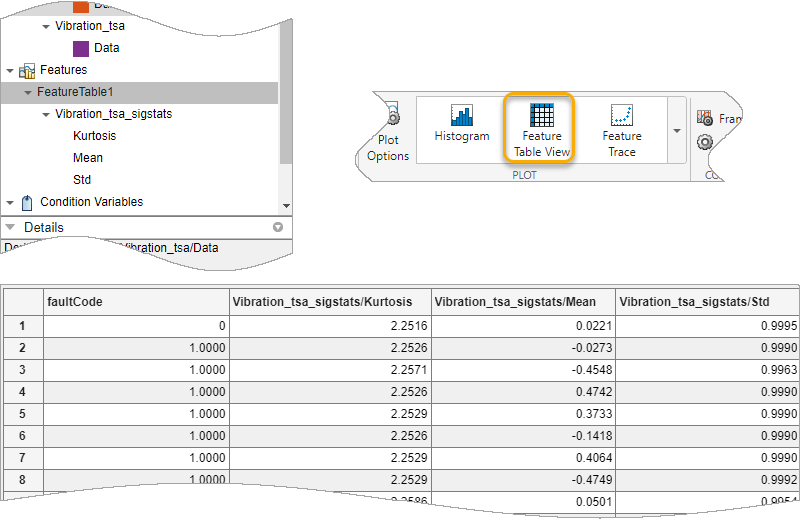
View the feature values. In the Variables pane, select
FeatureTable1. Then, in the plot gallery, click
Feature Table View. These steps open a table containing the feature
values for each member along with the condition variable faultCode.
Generate a MATLAB Function
Generate a MATLAB function that reproduces the calculations for these features. In the Feature Designer tab, select Export > Generate Function for Features.
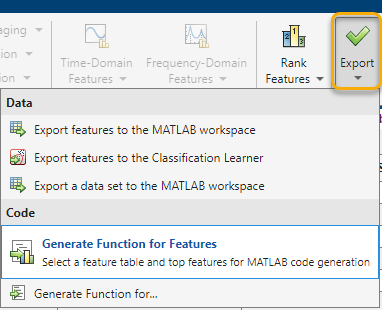
Your selection opens a dialog box that allows you to specify the feature table and the features. Because you have performed no ranking, the app configures the dialog box to export all three features.

When you click OK, a function script opens in the MATLAB editor that begins with the following lines.
function [featureTable,outputTable] = diagnosticFeatures(inputData)
%DIAGNOSTICFEATURES recreates results in Diagnostic Feature Designer.
%
% Input:
%  inputData: A table or a cell array of tables/matrices containing the
%  data as those imported into the app.
%
% Output:
%  featureTable: A table containing all features and condition variables.
%  outputTable: A table containing the computation results.
%
% This function computes signals:
%  Vibration_tsa/Data
%
% This function computes features:
%  Vibration_tsa_sigstats/Kurtosis
%  Vibration_tsa_sigstats/Mean
%  Vibration_tsa_sigstats/Std
%
% Organization of the function:
% 1. Compute signals/spectra/features
% 2. Extract computed features into a table
%
% Modify the function to add or remove data processing, feature generation
% or ranking operations.
diagnosticFeatures.m.For more information on the code content, see Anatomy of App-Generated MATLAB Code.
Validate Function with the Original Data
Run the function using dataTable to create a new feature table
featuretable.
featuretable = diagnosticFeatures(dataTable)
Compare the first eight feature values to the corresponding feature values in the app. At the level of the displayed precision, the values are identical.
  16×4 table

    faultCode    Vibration_tsa_stats/Kurtosis    Vibration_tsa_stats/Mean    Vibration_tsa_stats/Std
    _________    ____________________________    ________________________    _______________________

        0                   2.2516                       0.022125                    0.99955
        1                   2.2526                      -0.027311                      0.999
        1                   2.2571                       -0.45475                    0.99629
        1                   2.2526                        0.47419                      0.999
        1                   2.2529                        0.37326                      0.999
        1                   2.2526                       -0.14185                      0.999
        1                   2.2529                        0.40644                      0.999
        1                   2.2529                       -0.47485                    0.99915
See Also
readMemberData | read | workspaceEnsemble | writeToLastMemberRead | readFeatureTable | tsa