Design Filter
Description
Design Filter helps you design a digital filter
interactively. The task automatically generates MATLAB® code to design a filter using the digitalFilter object. If you have installed
DSP System Toolbox™, the task can generate MATLAB code to design and implement a filter using the dsp.FIRFilter (DSP System Toolbox) and the dsp.SOSFilter (DSP System Toolbox)
objects. These System objects filter streaming signals. (since R2023b)
To get started, select a filter response. The task offers controls to specify filter parameters that depend on the type of filter response. The filter parameters that you can specify include:
Sample rate
Filter order
Frequency constraints
Magnitude constraints
Design method
Select from a list of display options to visualize the generated filter response and
additional filter information. For a detailed description of the filter constraints, design
methods, and design method parameters, see the designfilt documentation.
For more information about Live Editor tasks, see Add Interactive Tasks to a Live Script.
Open the Task
To add the Design Filter task to a live script in the MATLAB Editor:
On the Live Editor tab, select Task > Design Filter.
In a code block in the script, type a relevant keyword, such as
designfilt,filter, orlowpass. SelectDesign Filterfrom the suggested command completions.
Examples
This example shows how to use the Design Filter task in the Live Editor to generate code for a digital filter. The task helps you interactively design a digital filter, displays the filter response, and generates code.
Create or Load Signal
In the Live Editor, load a noisy electrocardiogram (ECG) signal into the MATLAB® workspace. Plot the data.
load noisyecg
plot(noisyECG_withTrend)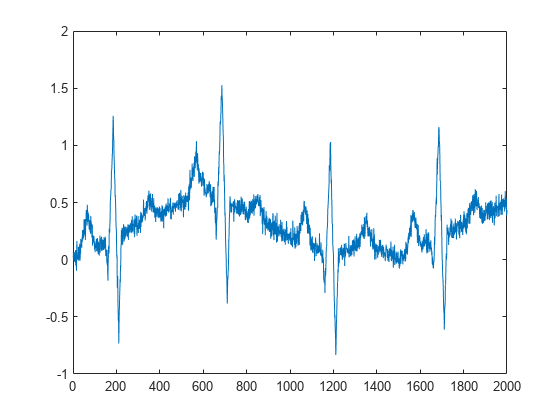
The ECG signal appears noisy. There are several sources of noise that can affect the signal including movement artifacts, high-frequency noise, and power source interference. Interactively design a filter to remove the noise from the signal. In the Live Editor tab, expand the Task list and select Design Filter to open the task.
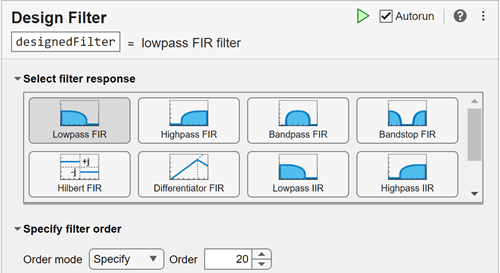
Design Lowpass FIR Filter
To remove high-frequency noise, first select a Lowpass FIR filter and specify the Order as 20. The available options for frequency, magnitude, and algorithm parameters depend on the selected filter response type and filter order.
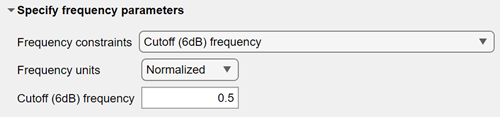
A lowpass filter removes from an input signal the unwanted frequency content above a specified threshold. In the Specify frequency parameters section, select Cutoff (6dB) frequency from the Frequency constraints list. When the sample rate is known, you can select Hz from the Frequency units list. A Sample rate option appears, and you can select a sample rate from the variables in the workspace. In this example, the sample rate is unknown, so specify a normalized cutoff frequency of 0.5 rad/sample.
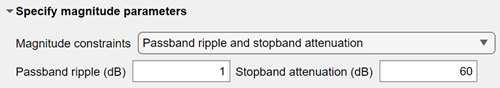
For an FIR lowpass filter, in the Specify magnitude parameters section, you can specify constraints to control the amount of passband ripple and stopband attenuation. Select Passband ripple and stopband attenuation from the Magnitude constraints list. Magnitude constraints and filter order can also affect the transition width of the filter.
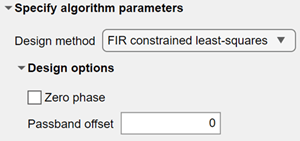
Select the FIR constrained least-squares design method. Leave the algorithm options at their default settings.
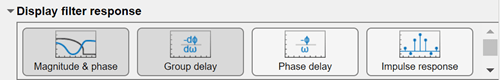
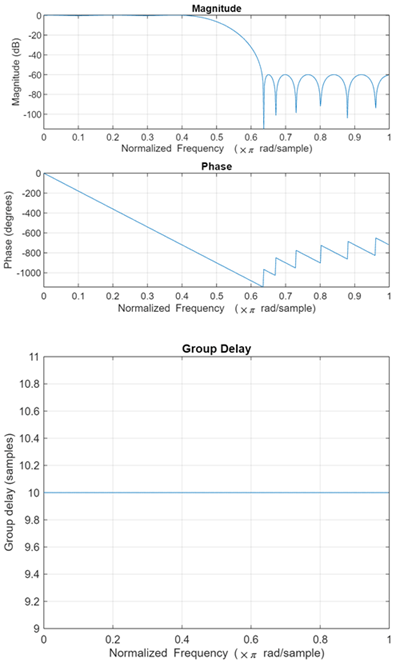
In the Display filter response section, select Magnitude & phase and Group delay to visualize the designed filter response. In the magnitude plot, you can see the level of attenuation in the stopband is at 60 dB. The group delay plot shows a delay of 10 samples and that the filter is linear phase.
Click the arrow below the Show code section to show the generated code for the designed filter. You can copy and paste the code on the command line to edit the filter design specifications manually.
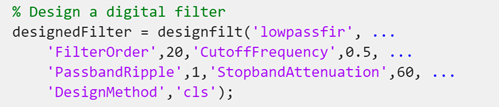
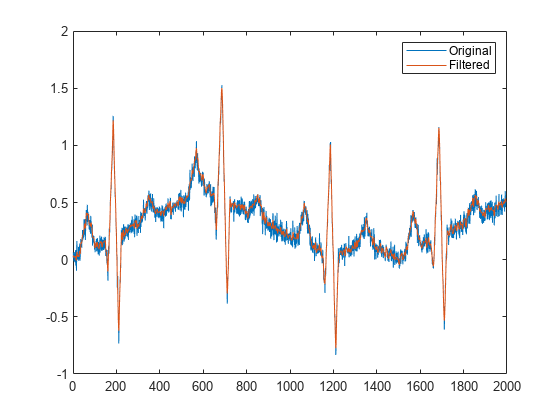
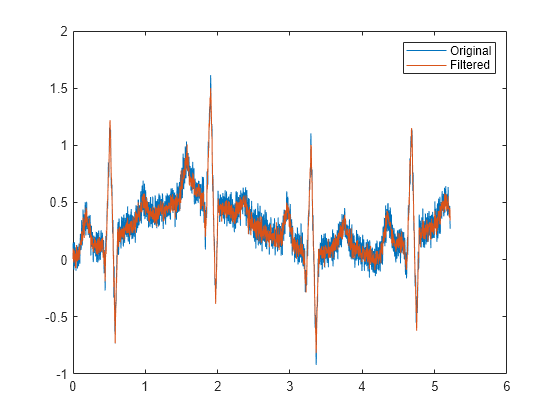
Apply the designed filter to the noisy ECG signal. Account for the delay introduced by the filter and plot the result.
load designedFilter
filteredECG = filter(designedFilter,noisyECG_withTrend);
delay = grpdelay(designedFilter);
mdelay = mean(delay);
filteredECG(1:mdelay) = [];

plot(noisyECG_withTrend(1:end-mdelay))
hold on
plot(filteredECG)
legend(["Original","Filtered"])
hold off
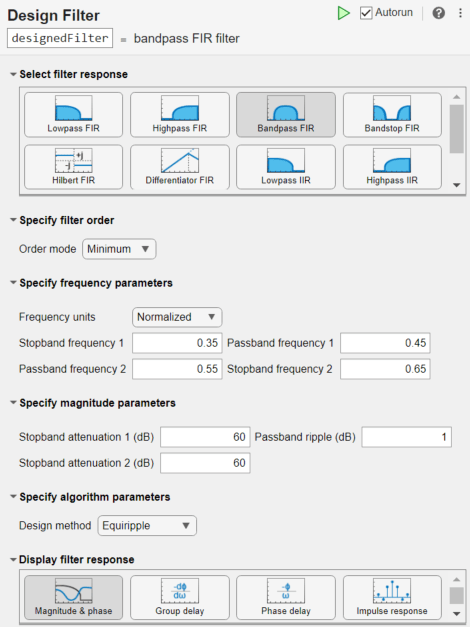
Design Equiripple Bandstop FIR Filter
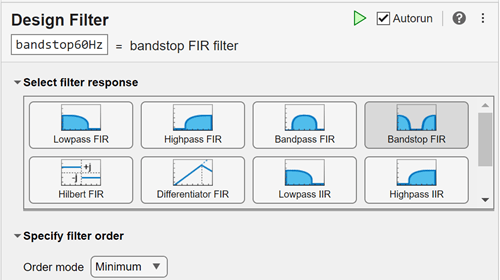
A medical device like an ECG monitor can be impacted by electromagnetic interference. A power source commonly operates at a frequency of 50 Hz or 60 Hz. For this example, a 60 Hz sinusoid was added as noise to an ECG signal taken from the MIT-BIH Arrhythmia Database [1]. The sample rate is 360 Hz. To remove the noise, open the Design Filter task and design a minimum-order bandstop FIR filter. Change the default filter name to bandstop60Hz.
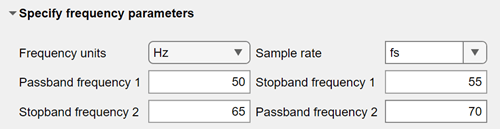
Specify the Frequency units as Hz. To specify a sample rate, enter a value or select a sample rate variable from the list. To appear in the list, a sample rate variable must be saved in the workspace. Create a variable, fs, and set it equal to 360 Hz, then select fs from the Sample rate list. Specify the passband and stopband frequency values to attenuate frequencies between 55–65 Hz for a 10 Hz notch filter centered at 60 Hz.
fs = 360;
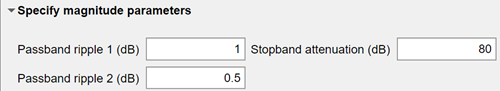
Set the Passband ripple 2 (dB) to 0.5 and increase the Stopband attenuation (dB) to 80.
The task defaults to an equiripple design method. Display the magnitude and phase responses of the filter.
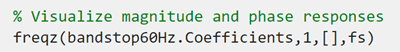
![]()
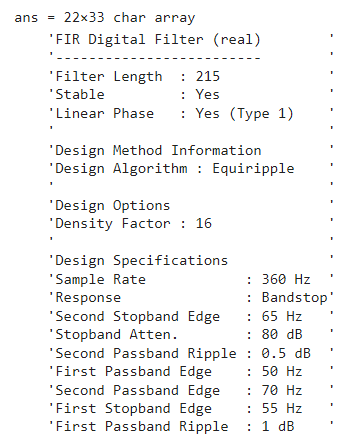
You can also select Filter information from the Display filter response section to view additional details about the designed filter.
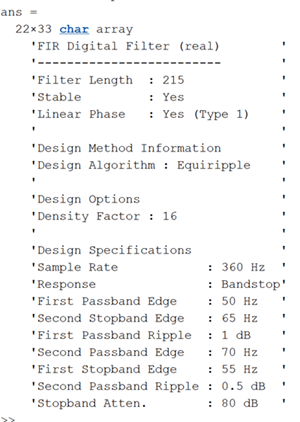
![]()
Load ecg60Hz into the workspace. The MAT file contains the original ECG signal with added noise (ecg60) and the filtered signal (ecgFilt). Plot both signals to visualize the filter result.
load ecg60Hz
t = 0:1/fs:(length(ecg60)-1)/fs;
plot(t,[ecg60 ecgFilt])
legend(["Original";"Filtered"])
Parameters
Tips
You can enable or disable the autorun option by selecting or clearing the Autorun checkbox in the top right corner of the task window. If you enable autorun, the current section including the task runs automatically when you make a change.
References
[1] Moody, G.B., and R.G. Mark. "The Impact of the MIT-BIH Arrhythmia Database". IEEE Eng in Med and Biol 20(3):45-50 (May-June 2001): 45-50.