主要内容

freqoctspace

R2026b

Frequency spacing for octave analysis

Since R2026b

    Description

    F = freqoctspace(Fmin,Fmax,Nsbpo) generates a row vector of logarithmically distributed mid-band frequencies, F, over the range specified in Fmin and Fmax using Nsbpo subbands per octave band.

    example

    F = freqoctspace(___,Name=Value) specifies additional options using name-value arguments, such as the reference frequency and the base to set the octave ratio.

    example

    [F,Fe] = freqoctspace(___) also returns the lower-band and upper-band edge frequencies in a two-row matrix FE with as many columns as mid-band frequencies returned in F.

    example

    Examples

    collapse all

    Generate a vector with mid-band frequencies for octave bands between 100 and 10000 Hz.

    Fm1 = freqoctspace(100,10000,1)
    Fm1 = 1×7
    103 ×
    
        0.1259    0.2512    0.5012    1.0000    1.9953    3.9811    7.9433


    Generate a vector with mid-band frequencies for octave subbands between 500 and 2000 Hz. Use 3 subbands per octave and an octave ratio base of 2.

    Fm3 = freqoctspace(500,2000,3,OctaveRatioBase=2)
    Fm3 = 1×7
    103 ×
    
        0.5000    0.6300    0.7937    1.0000    1.2599    1.5874    2.0000


    Create a signal comprising sinusoidal tones, where each tone spans one second.

    Fs = 5e3;
    N = length(Fm3);
    t = 0:1/Fs:N-1/Fs;
    x = sum(sin(2*pi*(Fm3'*t).*((t>=(0:N-1)').*(t<(1:N)'))),1);
    spectrogram(x,256,192,1024,Fs,"yaxis")
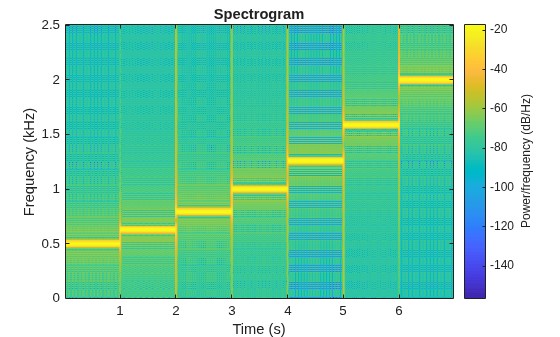
    Figure contains an axes object. The axes object with title Spectrogram, xlabel Time (s), ylabel Frequency (kHz) contains an object of type image.

    Generate a vector of frequencies spaced by 1/12 octave (equal temperament), starting from the note A0 (27.5 Hz) to the note C8 (4186 Hz), which covers the frequency range of a standard 88-key piano. Specify start and end frequencies just beyond A0 and C8 to ensure that they are covered by the band edge frequencies.

    [Fm88,Fe88] = freqoctspace(27,4187,12, ...
        OctaveRatioBase=2,ReferenceFrequency=440*2^(0.5/12));

    Plot the mid-band frequencies for the generated frequency space.

    semilogy(Fm88,"x")
    xlabel("Piano Key Number")
    ylabel("Frequency (Hz)")
    title("Equal-Tempered Piano Tuning (1/12 Octave Spacing)")
    grid on
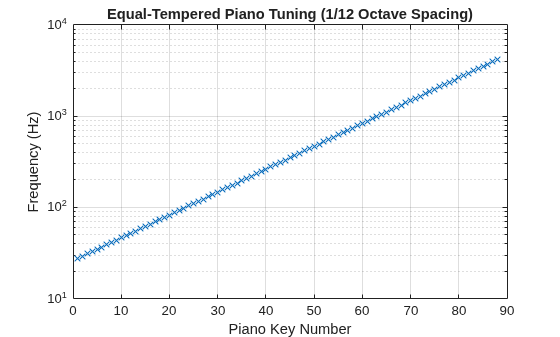
    Figure contains an axes object. The axes object with title Equal-Tempered Piano Tuning (1/12 Octave Spacing), xlabel Piano Key Number, ylabel Frequency (Hz) contains a line object which displays its values using only markers.

    Add the band edge frequencies for the generated frequency space and zoom in the plot for the piano keys 60 through 70.

    hold on
    semilogy(repmat(1:length(Fm88),2,1),Fe88,"k")
    hold off
    xlim([60 70])
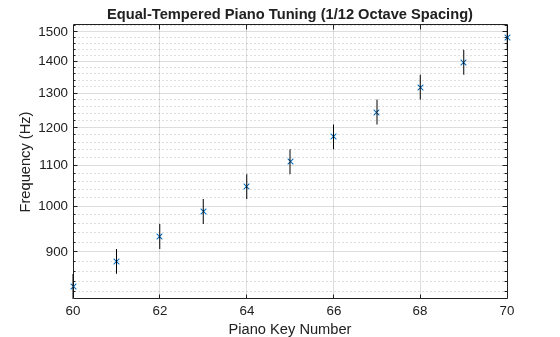
    Figure contains an axes object. The axes object with title Equal-Tempered Piano Tuning (1/12 Octave Spacing), xlabel Piano Key Number, ylabel Frequency (Hz) contains 89 objects of type line. One or more of the lines displays its values using only markers

    Input Arguments

    collapse all

    Minimum and maximum mid-band frequencies in Hz, specified as positive scalars where Fmax is greater or equal to Fmin.

    The function returns F so that each element, F(i), satisfies the condition Fmin <= F(i) <= Fmax. For more information, see Algorithms.

    Data Types: single | double

    Number of subbands per octave band, specified as a positive scalar.

    The function uses this argument to determine the width of each subband and calculates the corresponding lower-band, mid-band, and upper-band frequencies. For more information, see Algorithms.

    Data Types: single | double

    Name-Value Arguments

    collapse all

    Specify optional pairs of arguments as Name1=Value1,...,NameN=ValueN, where Name is the argument name and Value is the corresponding value. Name-value arguments must appear after other arguments, but the order of the pairs does not matter.

    Example: F = freqoctspace(60,480,4,OctaveRatioBase=2) creates a vector of frequencies logarithmically spaced between 60 Hz and 480 Hz with four bands per octave and using 2 as the base to set the octave frequency ratio.

    Reference center frequency in Hz, specified as a positive scalar.

    The function uses the reference center frequency to calculate the mid-band frequencies along the upper and lower bands. For more information, see Algorithms.

    Data Types: single | double

    Base to set the octave frequency ratio, specified as one of these values:

    • 10 — Use this base to set an octave frequency ratio of G = 100.3 = 1.9953, which approximates 2.

    • 2 — Use this base to set an octave frequency ratio of G = 21 = 2.

    The function calculates F so that the mid-band frequencies between consecutive octave bands have a ratio G. For more information, see Algorithms.

    Data Types: single | double

    Output Arguments

    collapse all

    Mid-band frequencies, returned as a row vector.

    Band edge frequencies, returned as a two-row matrix with as many columns as elements in F.

    The first and second rows of Fe contain the lower-band and upper-band edge frequencies associated with the mid-band frequencies in F, respectively. Each mid-band frequency is the geometric mean of the corresponding band edge frequencies, or F = sqrt(Fe(1,:).*Fe(2,:)).

    Algorithms

    Octave analysis is used to identify sound or vibration levels across a broad frequency range in a process that resembles how a human ear perceives sound. The freqoctspace function generates a vector that represents frequencies logarithmically distributed that form octaves, which you can use to perform octave analysis.

    Assume a reference frequency fr, an octave ratio G, and a distribution of b subbands per octave. The ANSI/ASA S1.11-2014/Part 1 / IEC 61260:1-2014 standard [1] defines the center frequencies of the octave bands, fc, as

    fc={fr×Gk/b,b is odd or nonintegerfr×G(2k−1)/2b,b is even

    where k is any integer and represents the band number above or below the reference frequency. Given a frequency range [fmin, fmax], the function trims fc so that fmin ≤ fc ≤ fmax.

    The center frequency definition differs depending on whether b is odd (for instance, for bandwidths of 1 octave or 1/3 octave), or even (for instance, for bandwidths of 1/2 octave or 1/6 octave). This definition ensures that the band edges of the whole octave band remain band edges for all of the fractional bands.

    The lower and upper edge frequencies of each octave band are given by

    flower=fc⋅(G−1/2b)

    fupper=fc⋅(G1/2b)

    References

    [1] Electroacoustics – Octave-band and Fractional-octave-band Filters – Part 1: Specifications (a nationally adopted international standard). ANSI/ASA S1.11-2014/Part 1 / IEC 61260:1-2014. Melville, NY: Acoustical Society of America, 2014.

    Extended Capabilities

    expand all

    C/C++ Code Generation
    Generate C and C++ code using MATLAB® Coder™.

    GPU Code Generation
    Generate CUDA® code for NVIDIA® GPUs using GPU Coder™.

    Version History

    Introduced in R2026b