modalsd
R2026bGenerate stabilization diagram for modal analysis
Description
modalsd(
generates a stabilization diagram in the current figure.
frf,f,Fs)modalsd estimates the natural frequencies and
damping ratios from 1 to 50 modes and generates the diagram using the
least-squares complex exponential (LSCE) algorithm. Fs is
the sample rate. The frequency, f, is a vector with a
number of elements equal to the number of rows of the frequency-response
function, frf. You can use this diagram to differentiate
between computational and physical modes.
modalsd(
specifies options using name-value arguments.frf,f,Fs,Name=Value)
fn = modalsd(___)fn, identified as being stable
between consecutive model orders. The ith element contains a
length-i vector of natural frequencies of stable poles.
Poles that are not stable are returned as NaNs. This syntax
accepts any combination of inputs from previous syntaxes.
Examples
Compute the frequency-response functions for a two-input/two-output system excited by random noise.
Load the data file. Compute the frequency-response functions using a 5000-sample Hann window and 50% overlap between adjoining data segments. Specify that the output measurements are displacements.
load modaldata
wl = 5000;

[frf,f] = modalfrf(Xrand,Yrand,fs,hann(wl),wl/2,Sensor="dis");
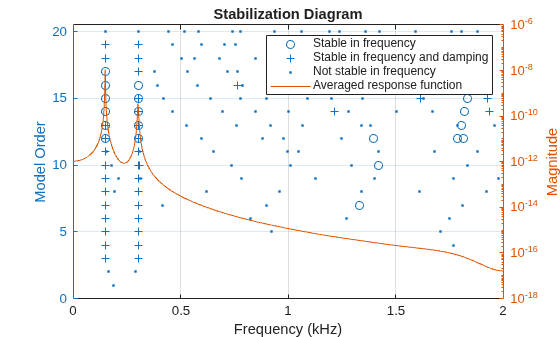
Generate a stabilization diagram to identify up to 20 physical modes.
modalsd(frf,f,fs,MaxModes=20)
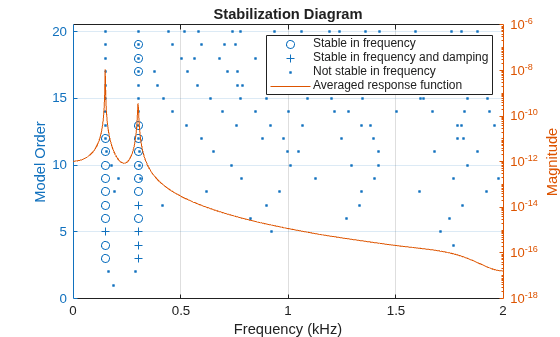
Repeat the computation, but now tighten the criteria for stability. Classify a given pole as stable in frequency if its natural frequency changes by less than 0.01% as the model order increases. Classify a given pole as stable in damping if the damping ratio estimate changes by less than 0.2% as the model order increases.
modalsd(frf,f,fs,MaxModes=20,SCriteria=[1e-4 0.002])
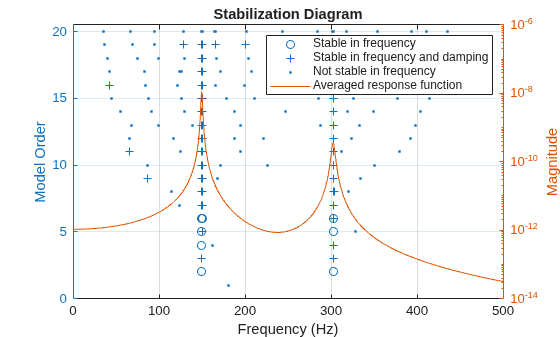
Restrict the frequency range to between 0 and 500 Hz. Relax the stability criteria to 0.5% for frequency and 10% for damping.
modalsd(frf,f,fs,MaxModes=20,SCriteria=[5e-3 0.1],FreqRange=[0 500])
Repeat the computation using the least-squares rational function algorithm. Restrict the frequency range from 100 Hz to 350 Hz and identify up to 10 physical modes.
modalsd(frf,f,fs,MaxModes=10,FreqRange=[100 350],FitMethod="lsrf")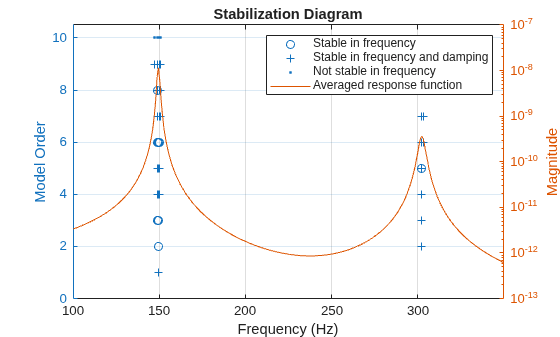
Input Arguments
Name-Value Arguments
Output Arguments
References
[1] Brandt, Anders. Noise and Vibration Analysis: Signal Analysis and Experimental Procedures. Chichester, UK: John Wiley & Sons, 2011.
[2] Ozdemir, Ahmet Arda, and Suat Gumussoy. "Transfer Function Estimation in System Identification Toolbox™ via Vector Fitting." Proceedings of the 20th World Congress of the International Federation of Automatic Control, Toulouse, France, July 2017.
[3] Vold, Håvard, John Crowley, and G. Thomas Rocklin. “New Ways of Estimating Frequency Response Functions.” Sound and Vibration. Vol. 18, November 1984, pp. 34–38.

