read
Read next consecutive signal observation
Description
Examples
Specify the path to a set of audio signals included as MAT files with MATLAB®.
folder = fullfile(matlabroot,"toolbox","matlab","audiovideo");
Create a signal datastore that points to the specified folder and set sample rate variable name to Fs. List the names of the MAT files in the datastore.
sds = signalDatastore(folder, ...
    FileExtension=".mat",SampleRateVariableName="Fs");
[~,c] = fileparts(sds.Files)
c = 7×1 cell
    {'chirp'   }
    {'gong'    }
    {'handel'  }
    {'laughter'}
    {'mtlb'    }
    {'splat'   }
    {'train'   }
While the signal datastore has unread files, read consecutive files from the datastore. Use the progress function to monitor the fraction of files read.
while hasdata(sds)
    [data,info] = read(sds);
    fprintf("Fraction of files read: %.2f\n",progress(sds))
end
Fraction of files read: 0.14
Fraction of files read: 0.29
Fraction of files read: 0.43
Fraction of files read: 0.57
Fraction of files read: 0.71
Fraction of files read: 0.86
Fraction of files read: 1.00
Print and inspect the info structure returned by the last call to the read function.
info
info = struct with fields:
             SampleRate: 8192
       TimeVariableName: "Fs"
    SignalVariableNames: "y"
               FileName: "/mathworks/devel/bat/filer/batfs2566-0/Bdoc26a.3233028/build/runnable/matlab/toolbox/matlab/audiovideo/train.mat"
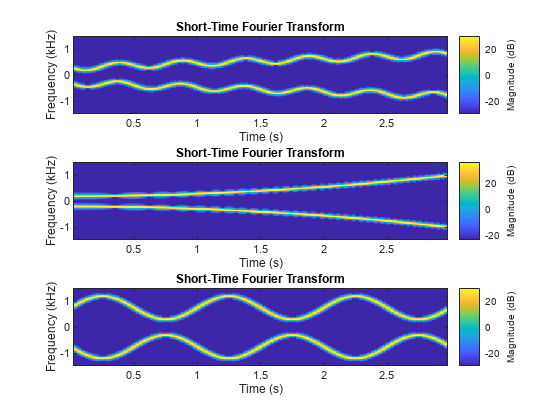
Create a signal datastore to iterate through the elements of an in-memory cell array of signal data. The data consists of a sinusoidally modulated linear chirp, a concave quadratic chirp, and a voltage controlled oscillator. The signals are sampled at 3000 Hz.
fs = 3000;
t = 0:1/fs:3-1/fs;
data = {chirp(t,300,t(end),800).*exp(2j*pi*10*cos(2*pi*2*t)); ...
        2*chirp(t,200,t(end),1000,'quadratic',[],'concave'); ...
        vco(sin(2*pi*t),[0.1 0.4]*fs,fs)};
sds = signalDatastore(data,'SampleRate',fs);
While the datastore has data, read each observation from the signal datastore and plot the short-time Fourier transform.
plotID = 1;
while hasdata(sds)
    [dataOut,info] = read(sds);
    subplot(3,1,plotID)
    stft(dataOut,info.SampleRate)
    plotID = plotID + 1;
end
Specify the path to four signals included with MATLAB®. The signals are recordings of a bird chirp, a gong, a train, and a splat. All signals are sampled at 8192 Hz.
folder = fullfile(matlabroot,'toolbox','matlab','audiovideo', ...
         ["chirp.mat","gong.mat","train.mat","splat.mat"]);
Create a signal datastore that points to the specified files. Each file contains the variable Fs that denotes the sample rate.
sds1 = signalDatastore(folder,'SampleRateVariableName','Fs');
Define a function that takes the output of the read function and calculates the upper and lower envelopes of the signals using spline interpolation over local maxima separated by at least 80 samples. The function also returns the sample times for each signal.
function [dataOut,infoOut] = signalEnvelope(dataIn,info)
    [dataOut(:,1),dataOut(:,2)] = envelope(dataIn,80,'peak');
    infoOut = info;
    infoOut.TimeInstants = (0:length(dataOut)-1)/info.SampleRate;
end
Call the transform function to create a second datastore, sds2, that computes the envelopes of the signals using the function you defined.
sds2 = transform(sds1,@signalEnvelope,"IncludeInfo",true);Combine sds1 and sds2 create a third datastore. Each call to the read function from the combined datastore returns a matrix with three columns:
The first column corresponds to the original signal.
The second and third columns correspond to the upper and lower envelopes, respectively.
sdsCombined = combine(sds1,sds2);
Read and display the original data and the upper and lower envelopes from the combined datastore. Use the extractBetween function to extract the file name from the file path.
tiledlayout('flow')
while hasdata(sdsCombined)
    [dataOut,infoOut] = read(sdsCombined);
    ts = infoOut{2}.TimeInstants;
    nexttile
    hold on
    plot(ts,dataOut(:,1),'Color','#DCDCDC','LineStyle',':')
    plot(ts,dataOut(:,2:3),'Linewidth',1.5)
    hold off
    xlabel('Time (s)')
    ylabel('Signal')
    title(extractBetween(infoOut{:,2}.FileName,'audiovideo\','.mat'))
end

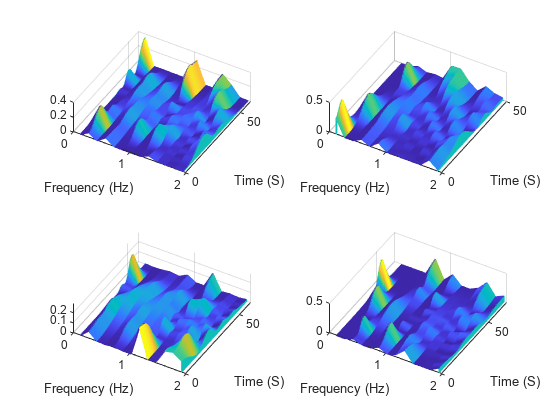
The sample_chirps folder contains sample files included with Signal Processing Toolbox™. Each file contains a chirp and a random sample rate, fs, ranging from 100 to 150 Hz. Create a signal datastore that points to four of the files in sample_chirps and specify the name of the sample rate variable.
addpath("sample_chirps")
files = ["chirp_1.mat","chirp_4.mat","chirp_9.mat","chirp_10.mat"];
sds = signalDatastore(files,SampleRateVariableName="fs");
Define a function that takes the output of the read function and computes and returns:
The spectrograms of the chirps.
The vector of time instants corresponding to the centers of the windowed segments.
The frequencies corresponding to the estimates.
function [dataOut,infoOut] = extractSpectrogram(dataIn,info)
    [dataOut,F,T] = pspectrum(dataIn,info.SampleRate,"spectrogram",...
                              TimeResolution=0.25,...
                              OverlapPercent=40,Leakage=0.8);
    infoOut = info;
    infoOut.CenterFrequencies = F;
    infoOut.TimeInstants = T;
end
Call the transform function to create a datastore that computes the spectrogram of each chirp using the function you defined.
sdsNew = transform(sds,@extractSpectrogram,IncludeInfo=true);
While the transformed datastore has unread files, read from the new datastore and visualize the spectrograms in three-dimensional space.
t = tiledlayout("flow");
while hasdata(sdsNew)
    nexttile
    [sig,infoOut] = read(sdsNew);
    waterfall(infoOut.TimeInstants,infoOut.CenterFrequencies,sig)
    xlabel("Frequency (Hz)")
    ylabel("Time (S)")
    view([30 70])
end
Specify the file path to the example signals included with MATLAB®. Create a signal datastore that points to the specified folder.
folder = fullfile(matlabroot,'toolbox','matlab','audiovideo');
sds = signalDatastore(folder,'SampleRateVariableName','Fs');
Get the default number of partitions for the signal datastore.
n = numpartitions(sds)
n =
7
Partition the datastore into the default number of partitions and return the datastore corresponding to the fourth partition.
subsds = partition(sds,n,4);
Use the extractAfter function to display the name of the file contained in the datastore corresponding to the fourth partition.
fName = extractAfter(subsds.Files,'audiovideo\')fName = 1×1 cell array
{0×0 char}
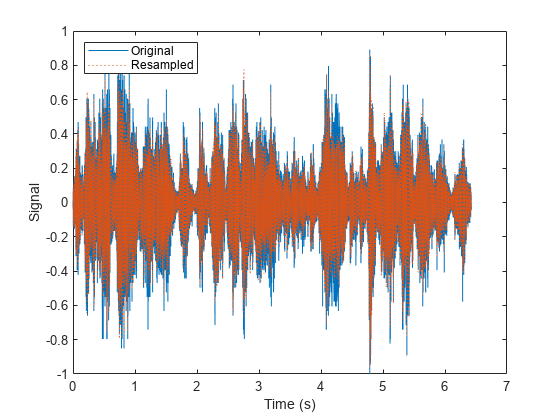
Read the data and information about the signal in the datastore corresponding to the fourth partition. Extract the sample rate from info and resample the signal to half the original sample rate. Plot the original and resampled signals.
while hasdata(subsds)
    [data,info] = read(subsds);
    fs = info.SampleRate;
    f_res = 0.5*fs;
    ts = (0:length(data)-1)/fs;
    data_res = resample(data,1,2);
    t_res = (0:length(data_res)-1)/f_res;
    plot(ts,data,t_res,data_res,':')
    xlabel('Time (s)')
    ylabel('Signal')
    legend('Original','Resampled','Location','NorthWest')
end
Input Arguments
Output Arguments
Version History
Introduced in R2020a