可视化电池仿真输出数据
此示例说明了如何使用包含 Simscape™ Battery™ 生成的模块的 Simulink™ 模型的输出中的动态电池图可视化电池仿真数据。在实际的电池应用中,电池电芯会根据冷却系统的设计以及电流收集器、母线和其他连接器的电气设计产生温度和荷电状态差异。
您可以使用 batterySimulationLog 对象选择要随时间绘制的电池变量或状态。然后,您可以将此对象作为输入传递给 batterySimulationChart 对象。此操作将变量随时间变化的值覆盖,并将其映射到 batteryChart 对象上。
在 MATLAB 中创建电池包对象
要创建电池 Pack 对象,必须先设计并创建电池包的基本元素。
创建 Cell 对象并定义可视化变量
首先创建并定义电池电芯的几何形状。CylindricalGeometry 对象定义了电池电芯的圆柱形几何排列。要创建一个 CylindricalGeometry 对象,请使用 batteryCylindricalGeometry 函数。要创建一个电芯对象,请使用 batteryCell 函数,并将 CylindricalGeometry 对象指定为第一个参量。
cylindricalGeometry = batteryCylindricalGeometry();
cylindricalCell = batteryCell(cylindricalGeometry);
将 Pack 对象的基本电芯模型模块更改为使用 Battery Equivalent Circuit 模块。在 batterycell 对象中指定 CellModelOptions 属性的 CellModelBlockPath 属性。
cylindricalCell.CellModelOptions.CellModelBlockPath = "batt_lib/Cells/Battery Equivalent Circuit";您可以使用 Cell 对象通过简单的一维模型仿真电池电芯的热效应。要仿真电池电芯的热效应,请在 Cell 对象的 CellModelOptions 对象的 BlockParameters 属性中,将 ThermalModel 属性设置为 "LumpedThermalMass"。只有先在电芯级别定义热模型,才能定义电池并联组件和模组的热边界条件。
cylindricalCell.CellModelOptions.BlockParameters.ThermalModel = "LumpedThermalMass";创建 ParallelAssembly 对象
并联组件包括多个电池电芯,这些电池电芯在特定的拓扑配置或几何排列下电连接成并联。在此示例中,您将创建一个由八个圆柱形电芯组成的并联组件。
要创建 ParallelAssembly 对象,请使用 batteryParallelAssembly 函数。将 Cell 对象指定为第一个参量,并将并联的电芯数指定为第二个参量。
parallelAssembly = batteryParallelAssembly(cylindricalCell,8, ...
    Rows=1, ...
    Topology="Square");
创建 Module 对象
电池模组由多个串联的并联组件组成。在此示例中,您将创建三个电池模组,每个模组包含两个并联组件。前两个模组具有分组模型分辨率。第三个模组具有集总模型分辨率。
要创建此 Module 对象,请使用 batteryModule 函数。将 ParallelAssembly 对象指定为第一个参量,并将串联的并联组件数指定为第二个参量。要定义其他属性,请使用名称-值参量 InterParallelAssemblyGap 和 StackingAxis。
groupedModule1 = batteryModule(parallelAssembly,2, ...
    SeriesGrouping=[1 1], ...
    ParallelGrouping=[8 1], ...
    InterParallelAssemblyGap=simscape.Value(0.005,"m"), ...
    StackingAxis="X");

groupedModule2 = batteryModule(parallelAssembly,2, ...
    SeriesGrouping=[1 1], ...
    ParallelGrouping=[1 8], ...
    InterParallelAssemblyGap=simscape.Value(0.005,"m"), ...
    StackingAxis="X");

lumpedModule = batteryModule(parallelAssembly,2, ...
    InterParallelAssemblyGap=simscape.Value(0.005,"m"), ...
    StackingAxis="X");
创建 ModuleAssembly 对象
电池模组组件由串联或并联的多个电池模组组成。在此示例中,您将创建一个由五个模组组成的电池模组组件,每个模组组件之间的间隙为 0.001 米。默认情况下,以电气方式串联 ModuleAssembly 对象。
要创建 ModuleAssembly 对象,请使用 batteryModuleAssembly 函数,并将 Module 对象指定为第一个参量。要定义其他属性,请使用名称-值参量 InterModuleGap 和 StackingAxis。
moduleAssembly = batteryModuleAssembly([groupedModule1,repmat(lumpedModule,1,3),groupedModule2], ...
    InterModuleGap = simscape.Value(0.001,"m"), ...
    StackingAxis="X");
创建 Pack 对象
现在,您已经拥有创建电池包的所有基本元素。电池包由多个串联或并联连接的电池模组组件组成。在此示例中,您将创建一个包含一个模组组件的电池包。默认情况下,以电气方式串联 Pack 对象。
要创建 Pack 对象,请使用 batteryPack 函数,并将 ModuleAssembly 对象指定为第一个参量。要定义其他属性,请使用名称-值参量 CoolantThermalPath 和 AmbientThermalPath。
pack = batteryPack(moduleAssembly, ...
    AmbientThermalPath="CellBasedThermalResistance", ...
    CoolantThermalPath="CellBasedThermalResistance");
可视化电池包并检查模型分辨率
要获得仿真所需的 Battery Equivalent Circuit 模块数量,请使用 pack 对象的 NumModels 属性。
disp(pack.NumModels)
21
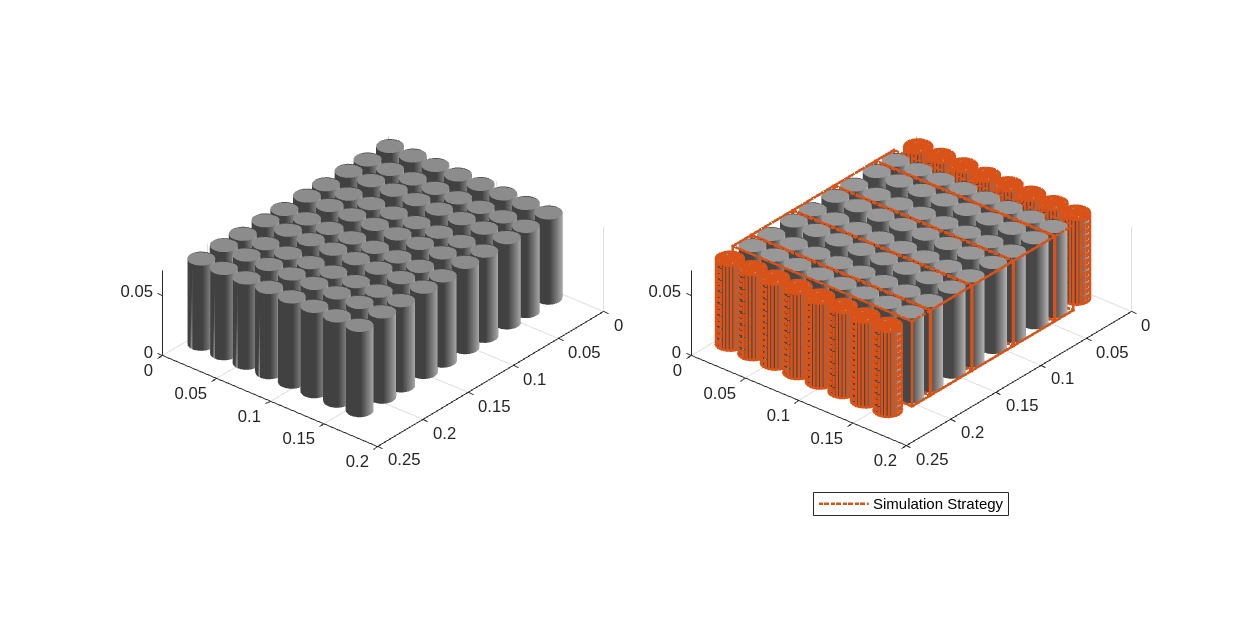
要在构建系统模型之前可视化电池包并查看其模型分辨率,请在要可视化电池包的位置创建图形,然后使用 batteryChart 函数。要查看 batterypack 对象的模型分辨率,请将 SimulationStrategyVisible 名称-值参量指定为 "On"。
f = figure(Color="w",Position=[0 0 1000 500]);
tl = tiledlayout(1,2,Parent=f,TileSpacing="Compact");
nexttile(tl)
packChart1 = batteryChart( tl,pack);
nexttile(tl)
packChart2 = batteryChart(tl,pack,SimulationStrategyVisible="On");
为电池包对象构建 Simscape 模型
创建电池对象后,需要将其转换为 Simscape 模型,以便在模块图中使用。然后,您可以将这些模型作为参考,用于系统集成和需求评估、冷却系统设计、控制策略开发、硬件在环等许多应用。
要创建一个包含 Pack 对象的 Simscape Battery 模型的库,请使用 buildBattery 函数。要创建一个可以单独定义所有电池参数的脚本,请将函数 buildBattery 的参量 MaskParameters 设置为 "VariableNamesByType"。要将初始目标作为脚本的一部分包括在内,请将 buildBattery 函数的 MaskInitialTargets 参量设置为 VariableNamesByInstance"。
在工作文件夹中创建 packVisualization_lib 和 packVisualization SLX 库文件。packVisualization_lib 库包含 Modules 和 ParallelAssemblies 子库。此函数还会创建一个扩展名为 .m 的 packVisualization_param 脚本,其中包含运行电池仿真所需的所有必要参数。
libraryname = "packVisualization";
buildBattery(pack,LibraryName=libraryname, ...
    MaskParameters="VariableNamesByType", ...
    MaskInitialTargets="VariableNamesByInstance");
创建并仿真电池模型
创建包含所需电池模型的电池库后,必须创建 Simulink 模型。然后,仿真此模型,以获得记录的仿真数据。
创建 Simulink 模型
创建并打开 Simulink 模型。定义模型名称并使用 open_system 函数。
modelname = "packVisualizationModel";
open_system(new_system(modelname));
该示例以编程方式添加了仿真电池模组模型所需的所有模块。要添加这些模块,请将其模块路径定义为工作区中的变量。
batteryBlockPath = strcat(modelname,"/",pack.Name);
electricalRefBlockPath = strcat(modelname,"/","ElectricalReference");
solverConfigBlockPath = strcat(modelname,"/","Solver");
currentSourceBlockPath = strcat(modelname,"/","Controlled Current Source");
ambientTemperatureSourceBlockPath = strcat(modelname,"/","Temperature Source");
coolantTemperatureSourceBlockPath = strcat(modelname,"/","Temperature Source Clnt");
将模块添加到模型中。使用 add_block 函数。
add_block(strcat(libraryname,"/",pack.Name),batteryBlockPath,position=[150,100,300,250]);
add_block("fl_lib/Electrical/Electrical Elements/Electrical Reference",electricalRefBlockPath,position=[165,320,185,340],orientation="down",ShowName="off");
add_block("nesl_utility/Solver Configuration",solverConfigBlockPath,position=[-80,280,-30,320]);
add_block("fl_lib/Thermal/Thermal Sources/Temperature Source",ambientTemperatureSourceBlockPath,position=[205,300,245,340],ShowName="off");
add_block("fl_lib/Thermal/Thermal Sources/Temperature Source",coolantTemperatureSourceBlockPath,position=[255,300,295,340],ShowName="off");
要定义电气负载情况,请添加一个 DC Current Source 模块,并将电流设置为放电方向的 160 安培。
add_block( "fl_lib/Electrical/Electrical Sources/DC Current Source",currentSourceBlockPath,position=[-30,150,0,200],orientation="down",i0=num2str(-160));
获取模块端口的句柄,并连接所有模块。
batteryBlockPortHandles = get_param(batteryBlockPath,"PortHandles");
electricalRefBlockPortHandles = get_param(electricalRefBlockPath,"PortHandles");
solverConfigBlockPortHandles = get_param(solverConfigBlockPath,"PortHandles");
currentSourceBlockPortHandles = get_param(currentSourceBlockPath,"PortHandles");
ambientTemperatureSourceBlockPortHandles = get_param(ambientTemperatureSourceBlockPath,"PortHandles");
coolantTemperatureSourceBlockPortHandles = get_param(coolantTemperatureSourceBlockPath,"PortHandles");

add_line(modelname,batteryBlockPortHandles.RConn(1),currentSourceBlockPortHandles.RConn,autorouting="smart");
add_line(modelname,batteryBlockPortHandles.LConn,currentSourceBlockPortHandles.LConn,autorouting="smart");
add_line(modelname,batteryBlockPortHandles.RConn(1),electricalRefBlockPortHandles.LConn,autorouting="smart");
add_line(modelname,batteryBlockPortHandles.RConn(1),solverConfigBlockPortHandles.RConn,autorouting="smart");
add_line(modelname,batteryBlockPortHandles.RConn(2),ambientTemperatureSourceBlockPortHandles.LConn,autorouting="smart");
add_line(modelname,batteryBlockPortHandles.RConn(3),coolantTemperatureSourceBlockPortHandles.LConn,autorouting="smart");
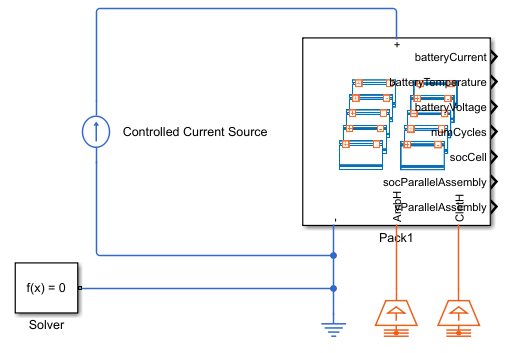
下图显示了生成的电池模型:
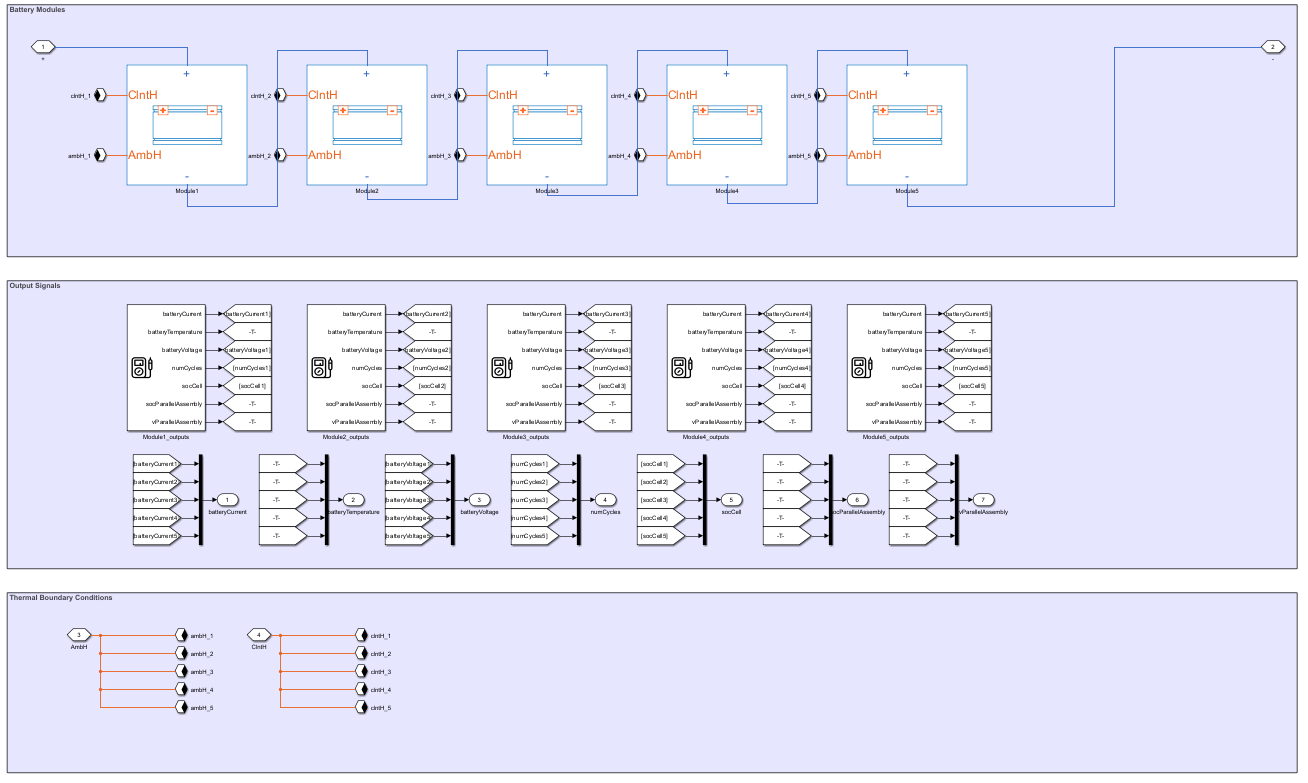
此图显示了 Module Assembly 模块的内部布局:
仿真模型
要可视化 BatterySimulationChart 对象中的电池仿真输出,必须先启用 Simscape 信号记录。要启用记录,请在 Simulink 模型中将 SimscapeLogType 属性设置为 "all"。
set_param(modelname,"SimscapeLogType","all")
要运行仿真,必须先运行参数化脚本。
run(strcat(libraryname,"_param.m"));通过修改 Module 模块的初始目标,将电池温度和荷电状态初始化为不同的值。修改初始荷电状态。
ModuleAssembly1.Module1.socCell = [repmat(0.8, 8, 1);0.7]; % Cell state of charge of module 1
ModuleAssembly1.Module2.socCell = 0.8; % Cell state of charge of module 2
ModuleAssembly1.Module3.socCell = 0.8; % Cell state of charge of module 3
ModuleAssembly1.Module4.socCell = 0.8; % Cell state of charge of module 4
ModuleAssembly1.Module5.socCell = [0.9;repmat(0.8, 8, 1)]; % Cell state of charge of module 5
修改初始温度。
ModuleAssembly1.Module1.batteryTemperature = [repmat(305, 8, 1);302]; % Temperature of module 1, K
ModuleAssembly1.Module2.batteryTemperature = 305; % Temperature of module 2, K
ModuleAssembly1.Module3.batteryTemperature = 306; % Temperature of module 3, K
ModuleAssembly1.Module4.batteryTemperature = 304; % Temperature of module 4, K
ModuleAssembly1.Module5.batteryTemperature = [308; 309; 310; 310; 310; 311; 312; 314; 314]; % Temperature of module 5, K
修改热阻参数。
ModuleType1.CoolantResistance = [12,14,16,18,20,22,24,26,20];
ModuleType2.CoolantResistance = 25;
ModuleType3.CoolantResistance = [22,24,26,28,30,32,34,36,30];

ModuleType1.AmbientResistance = repmat(200,1,9);
ModuleType2.AmbientResistance = 200;
ModuleType3.AmbientResistance = ModuleType1.AmbientResistance;
运行仿真。使用函数 sim,并定义参量 StartTime 和 StopTime。
out = sim(modelname,StartTime="0",StopTime="600");
创建动态电池可视化
要选择在 BatterySimulationChart 中绘制的变量和变量单位,必须先创建一个 BatterySimulationLog 对象。要创建 BatterySimulationLog 对象,请使用 batterySimulationLog 函数。指定用于创建电池模型库的电池对象作为第一个参量,指定来自 Simulink 模型中的该电池模块的仿真输出数据作为第二个参量。
batterySimLog = batterySimulationLog(pack,out.simlog.Pack1);
要显示可绘制的变量,请访问 BatterySimulationLog 对象的 ModelVariables 属性。这些变量与基本电芯模型模块中的公共变量相对应。
disp(batterySimLog.ModelVariables)
"batteryTemperature" "batteryVoltage" "socCell" "batteryCurrent" "numCycles"
要选择另一个变量,请指定 SelectedVariable 属性。软件会自动为变量选择默认单位。然后,您就可以在 SelectedVariableUnit 属性中定义一个相称的单位。
batteryCurrentSimLog = batterySimLog;
batteryCurrentSimLog.SelectedVariable = "batteryCurrent";

batteryStateOfChargeSimLog = batterySimLog;
batteryStateOfChargeSimLog.SelectedVariable = "socCell";
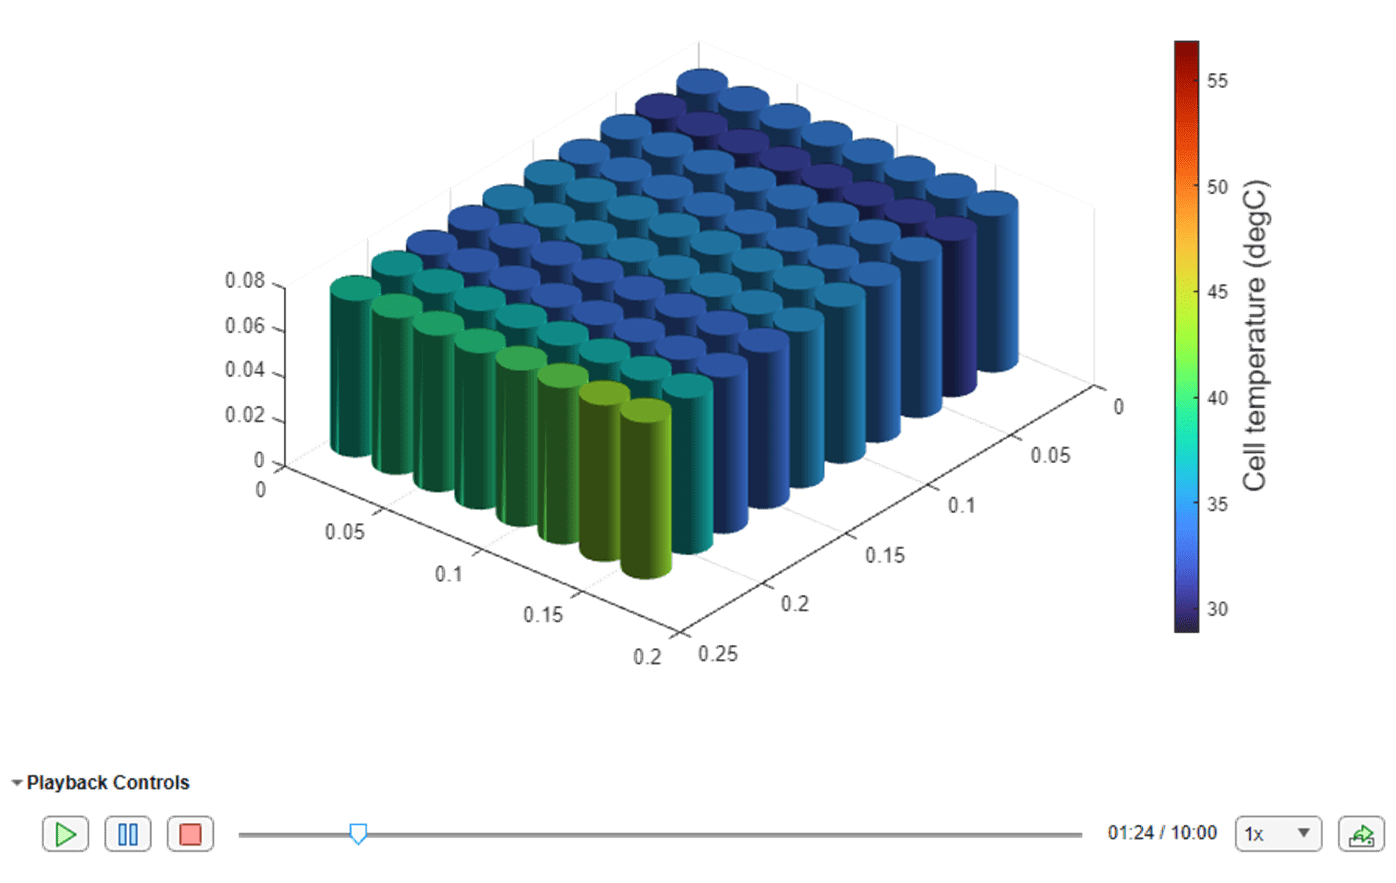
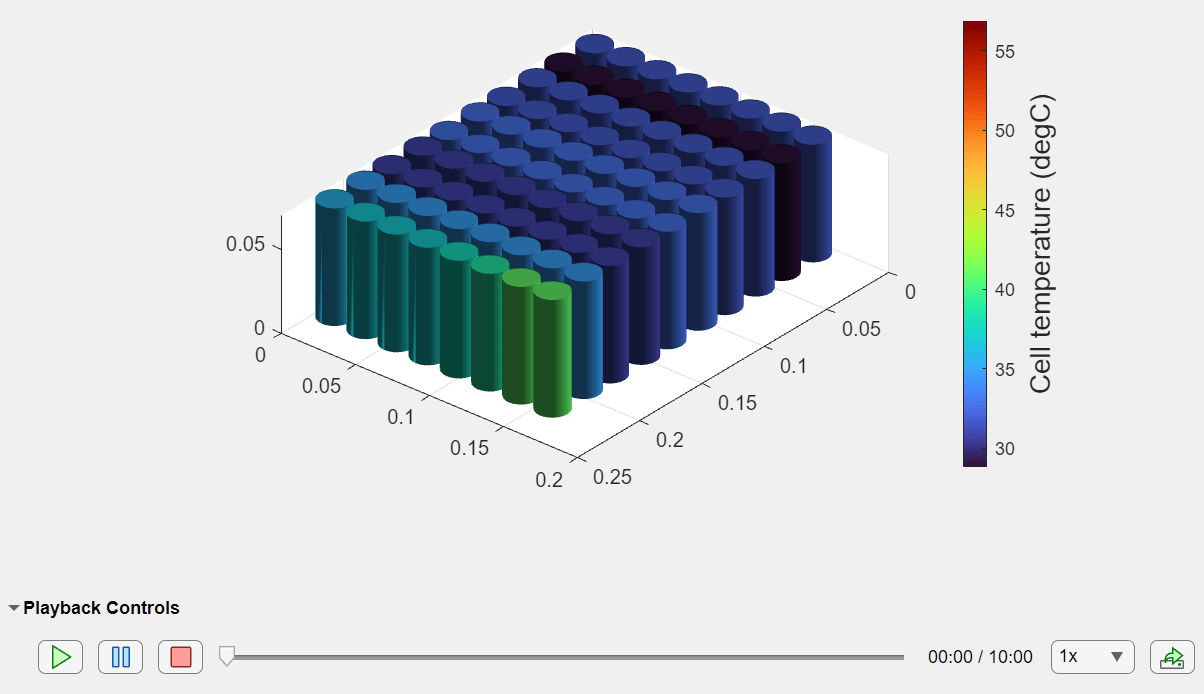
要可视化温度变量的值,请使用函数 batterySimulationChart。
f = uifigure(Color="w");
g = uigridlayout(f,[1 1]);
packChart = batterySimulationChart(g,batterySimLog);
packChartColorBar = colorbar(packChart);
ylabel(packChartColorBar, strcat("Cell temperature"," (",batterySimLog.SelectedVariableUnit,")"),FontSize=14);
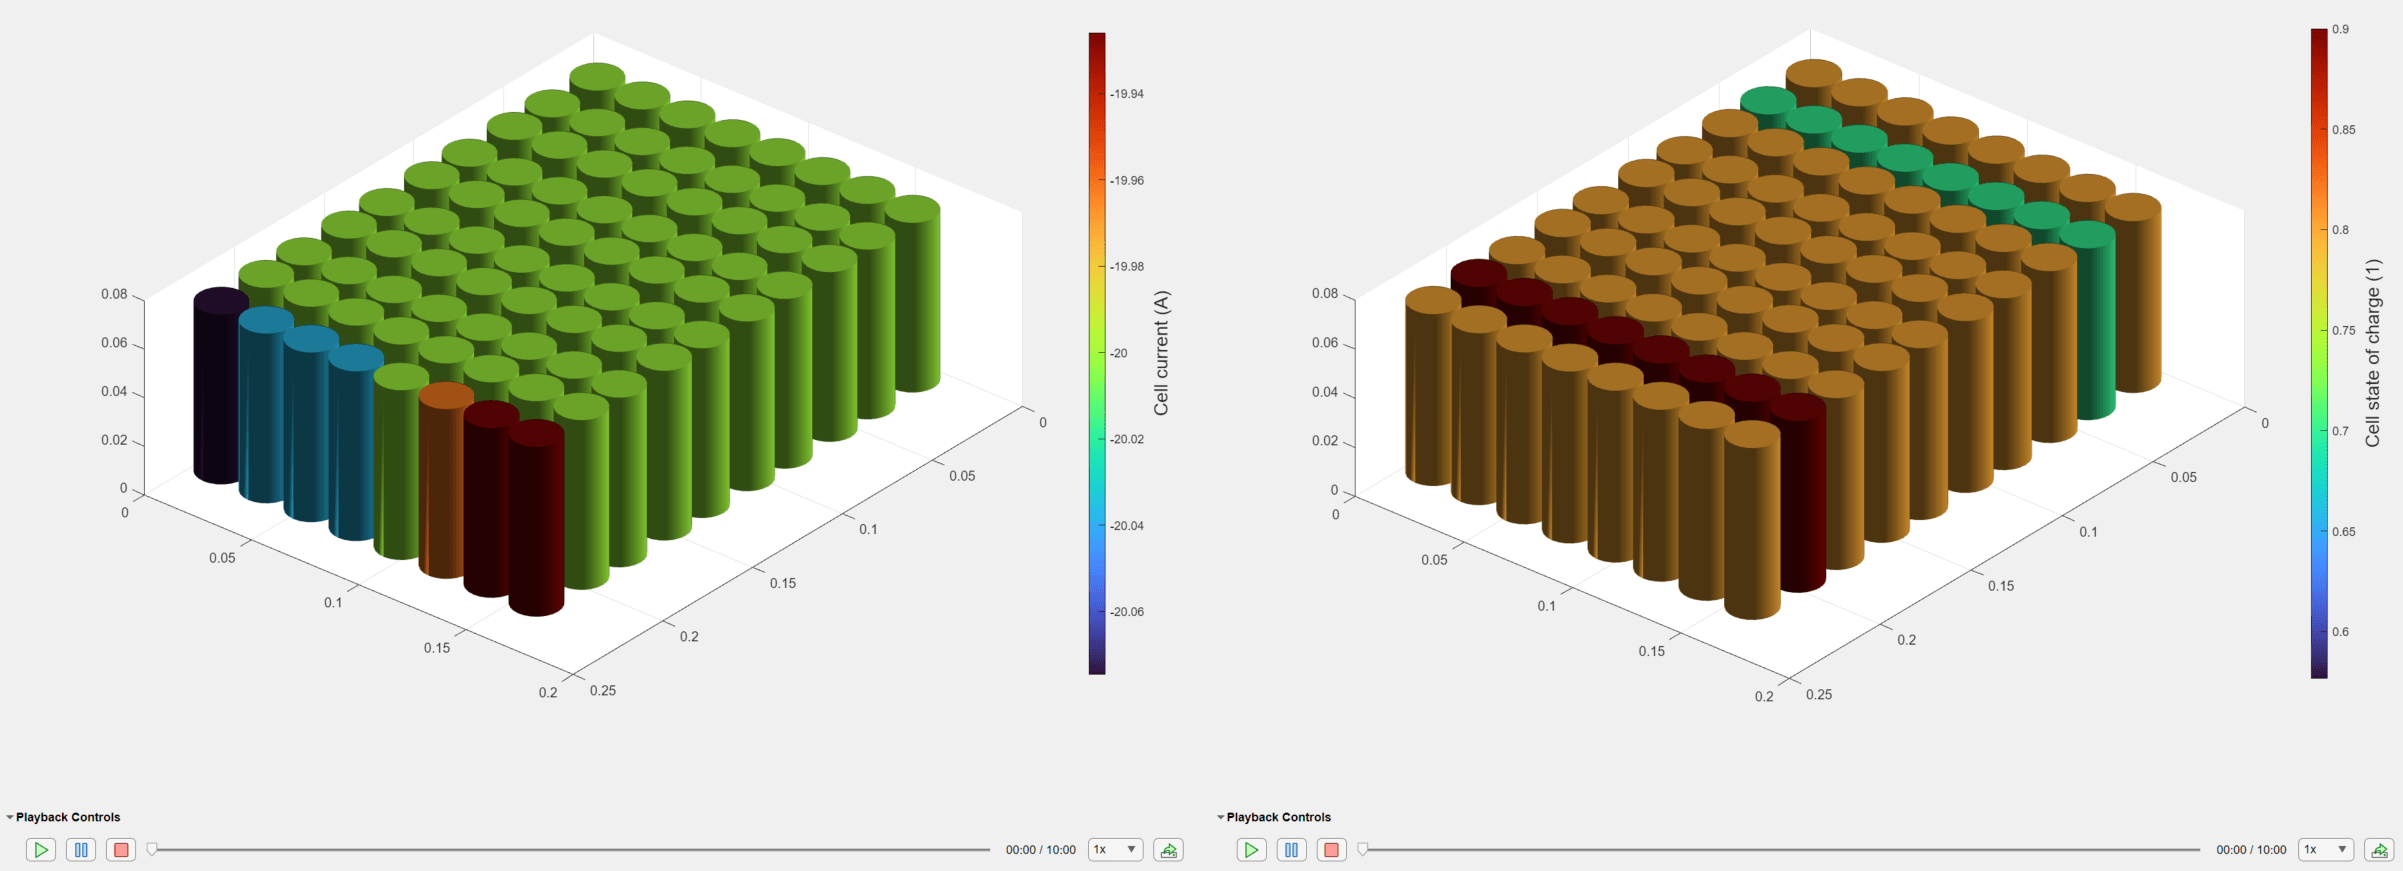
可视化电流和荷电状态。
f = uifigure(Color="w");
g = uigridlayout(f,[1 2]);
packCurrentChart = batterySimulationChart(g,batteryCurrentSimLog);
packCurrentChartColorBar=colorbar(packCurrentChart);
ylabel(packCurrentChartColorBar,strcat("Cell current"," (",batteryCurrentSimLog.SelectedVariableUnit,")"),FontSize=14);
packCurrentChartColorBar = colormap(packCurrentChart);

packStateOfChargeChart = batterySimulationChart(g,batteryStateOfChargeSimLog);
packStateOfChargeChartColorBar = colorbar(packStateOfChargeChart);
ylabel(packStateOfChargeChartColorBar,strcat("Cell state of charge", " (",batteryStateOfChargeSimLog.SelectedVariableUnit,")"),"FontSize",14 );
packStateOfChargeChartColorBar = colormap(packChart);
另请参阅
电池构建器 | Pack | BatterySimulationLog | BatterySimulationChart