Migrating from Metrics Dashboard to Model Design Dashboards
R2026bThe Model Design Dashboards collect metric data from the model design artifacts in a project to help you assess the quality of your design. If you currently use the Metrics Dashboard, you can use the Model Maintainability Dashboard and the Model Design Dashboard instead. The Model Maintainability Dashboard analyzes the size, architecture, and complexity of your design without compiling the model. The Model Design Dashboard provides a high-level overview of design quality, including size, complexity, requirements traceability, diagnostics, and reuse. To migrate to the Model Design Dashboards, create a project for your model, fix artifact traceability issues, and update code you use to collect and display metric results.
There are differences between the metric results from the Metrics Dashboard and Model Design Dashboards. These differences are expected because these dashboards use different metrics and calculate metric results differently. For a comparison of the metrics, see Choose Which Metrics to Collect.
The Model Design Dashboards do not support all of the capabilities available in the Metrics Dashboard. For more information, see Limitations.
Advantages of the Model Design Dashboards
The Metrics Dashboard runs on an individual model or subsystem and requires a computationally intensive, compile-based analysis for many metrics.
The Model Maintainability Dashboard can analyze Simulink® models, Stateflow® charts, and MATLAB® code in your project to help you determine if parts of a design are too complex and need to be refactored. The Model Maintainability Dashboard can:
Collect metrics without compiling the model.
Trace the relationships between models and related design artifacts.
Automatically identify metric results that are outdated due to changes in the project.
Aggregate metrics across software units in software components. You can explicitly specify the boundaries of aggregation by using project labels to categorize the units and components.
Provide metrics, such as Halstead difficulty, that are not available in the Metrics Dashboard. For an overview of the metrics, see Model Design Metrics and Model Maintainability Metrics.
Generate a report that contains the metric results.
The Model Design Dashboard provides a high-level overview of design quality across a project. The Model Design Dashboard can:
Assess the size and composition of your design across Simulink, Stateflow, and MATLAB code.
View complexity metrics, such as Halstead difficulty and cyclomatic complexity, and drill down to the Model Maintainability Dashboard for detailed analysis.
Review requirements traceability, including implemented requirements, link types, and broken links.
Check recent compile results and code issues from the MATLAB Code Analyzer.
Identify opportunities for reuse through referenced models, linked libraries, subsystem references, and Clone Detector results.
Additionally, the Model Design Dashboards use the same dashboard user interface and metric API as the Model Testing Dashboards.
For an overview of the dashboard metrics and results, see Explore Metric Results, Monitor Progress, and Identify Issues.
How to Migrate to the Model Design Dashboards
To migrate to the Model Design Dashboards, set up a project for your model, fix artifact traceability issues, and update code that you use to collect and display metric results.
Create and Open Project
To use the Model Design Dashboards, your models must be inside a project. The project folder, and referenced project folders, define the scope of the artifacts that the dashboard metrics analyze and help the dashboard to detect when metric results become outdated. If you already have a project that contains your model, open the project. Otherwise, you can create a project directly from your model or create an empty project. For more information, see Create Project to Use Model Design and Model Testing Dashboards.
Open Dashboard and Enable Artifact Tracing
After you open your project, open a Model Design Dashboard. On the Project tab, in the Tools section, click Model Design Dashboard.
When you open a dashboard for a project for the first time, the Enable Artifact Tracing dialog box opens and prompts you to enable artifact tracing for the project. The dashboard uses artifact tracing to create a digital thread that monitors the project for changes and identifies whether the changes invalidate the metric results. Click Enable and Continue to create a digital thread for the project.
The Dashboard window opens and automatically opens a Model Design dashboard tab for a model in the project. The Dashboard window provides a centralized location where you can open dashboards for the models in your project, view metric results, analyze affected artifacts, and generate reports on the quality and compliance of the artifacts in your project. For more information, see Analyze Your Project with Dashboards.
Review Units and Components
Your software units and components appear in the Project panel in the Model Design Dashboards. A unit is a functional entity in your software architecture that you can execute and test independently or as part of larger system tests. A component is an entity that integrates multiple testable units together. By default, the dashboard considers each Simulink model inside your project folder as a unit and each System Composer™ architecture model as a component. The dashboard categorizes models as units and components because software development standards, such as ISO 26262-6, define objectives for unit testing. The Model Design Dashboard analyzes units in your project. The Model Maintainability Dashboard analyzes both units and components. For more information, see Categorize Models in Hierarchy as Components or Units.
If you want to exclude certain models from the dashboard, specify which models are units or components by labeling them in your project and configuring the dashboard to recognize the label, as shown in Specify Models as Components and Units. If you expect a model to appear in the Project panel and it does not, see Fix Artifact Issues.
Fix Artifact Issues
The dashboard finds artifact issues in the project that lead to unsaved information,
portability issues, or ambiguous relationships between artifacts. These issues can cause
certain artifacts not to appear in the dashboard, which can lead to incorrect metric
results. To investigate artifact issues, click the Traceability
tab, then click the Artifact Issues button. The warning
 and error
 icons in the dashboard toolstrip indicate the artifact issues. For information on how to view
artifact issues, see View Artifact Issues in Project. For information on
how to fix artifact issues, see Resolve Missing Artifacts, Links, and Results.
icons in the dashboard toolstrip indicate the artifact issues. For information on how to view
artifact issues, see View Artifact Issues in Project. For information on
how to fix artifact issues, see Resolve Missing Artifacts, Links, and Results.
Collect Dashboard Results
The Model Design Dashboards collect metric data from the model design artifacts in your project to help you assess the size, architecture, and complexity of your design. The dashboard can collect these metrics without needing to compile the model and can automatically identify outdated metric results when artifacts in the project change.
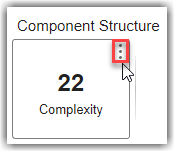
To view information about a metric and how the dashboard calculates the metric value,
point to a widget, then point to the three dots in the top-right corner of the widget,
and click the Help icon
 . For an overview of the Model Design Dashboards and metrics, see Assess Model Design Using Model Design Dashboard and Monitor Design Complexity Using Model Maintainability Dashboard.

Update Programmatic Metric Collection
For the Metrics Dashboard, you use a slmetric.Engine object to collect metric results. For the Model Design
Dashboards, you use a metric.Engine object to collect metric results. The way you collect metrics
programmatically is similar for both dashboards, but you need to update your code. This
table shows the programmatic differences in how you collect metric results for a model,
in this case the number of Simulink blocks in a model named myModel. For more information,
see metric.Engine and Collect Model Maintainability Metrics Programmatically.
| Functionality |
slmetric.Engine API for Metrics Dashboard
|
metric.Engine API for Model Maintainability
Dashboard
| More Information |
|---|---|---|---|
| Creating Metric Engine |
metric_engine = slmetric.Engine(); |
metric_engine = metric.Engine(); | See |
| Specifying Scope of Analysis |
setAnalysisRoot(metric_engine,'Root','myModel','RootType','Model'); | For the Model Design Dashboards, you do not need to set an
analysis root. By default, the | See the |
| Collecting Metric Results |
execute(metric_engine,'mathworks.metrics.SimulinkBlockCount'); |
model = "myModel"; storageMap = digitalthread.StorageMap.forProject(); load_system(model); modelID = digitalthread.uri.simulink.fromObject(storageMap,get_param(model,"Handle")); metricID = "modeldesign.SimulinkMaintainability[]"; results = execute(metric_engine,metricID,ScopeId=modelID) | See the Both dashboards have metrics for model size, architecture, and complexity. However, for some metrics, you might see a difference between the results from the Metrics Dashboard and Model Design Dashboards. For a comparison of the metrics, see the metric comparison in Choose Which Metrics to Collect. |
| Accessing Metric Results |
results = getMetrics(metric_engine,'mathworks.metrics.SimulinkBlockCount'); |
results = getMetrics(metric_engine,"modeldesign.SimulinkMaintainability[slcomp.DesignSummary]");
v = results.Value
v =
struct with fields:
AccumulatedElements: 8
Blocks: 55
Complexity: 9
Gotos: 0
HalsteadDifficulty: 25.5609
SignalLines: 88 | See the |
| Getting Available Metrics |
modelMetrics = slmetric.metric.getAvailableMetrics(); |
designMetricIDs = getAvailableMetricIds(metric_engine,App="DashboardApp",Dashboard="ModelUnitDesign"); maintainabilityMetrics = getAvailableMetricIds(metric_engine,App="DashboardApp",Dashboard="ModelMaintainability"); | See the For details on the metrics, see Model Design Metrics and Model Maintainability Metrics. |
Choose Which Metrics to Collect
The Model Design Dashboards provide size, architecture, complexity, diagnostic, and reuse metrics that are similar to the Size Metrics, Architecture Metrics, and other metrics in the Metrics Dashboard. Some Metrics Dashboard metrics, such as the Readability Metrics and the Model Advisor metrics in the Compliance Metrics, are not supported. For more information, see Limitations.
These tables summarize how metrics in the Metrics Dashboard relate to metrics in the Model Design Dashboards.
Note
There are differences between the metric results from the Metrics Dashboard and Model Design Dashboards. These differences are expected because these dashboards use different metrics and calculate metric results differently. In particular, the Metrics Dashboard calculates many metric results by using a compiled representation of a model, which can differ from the Simulink model that you edit. The Model Design Dashboards calculate metric results using the graphical representation of the model and scope the analysis to each unit or component and its supporting artifacts in the project folder.
Size Metrics
| Metrics Dashboard Functionality | Use This Instead |
|---|---|
| Simulink Block Metric | The Model Design Dashboards also provide other Simulink Maintainability metrics that are not available in the Metrics Dashboard. |
| Subsystem Metric | No replacement |
| Library Link Metric | |
| Effective Lines of MATLAB Code Metric | |
| Stateflow Chart Objects Metric | The Model Maintainability Dashboard provides other Stateflow Maintainability metrics that are not available in the Metrics Dashboard. |
| Lines of Code for Stateflow Blocks Metric | |
| Subsystem Depth Metric | The Model Maintainability Dashboard provides other Component Structure and Interfaces metrics that are not available in the Metrics Dashboard. |
| Input Output Metric | |
| Explicit Input Output Metric | |
| File Metric | No replacement |
| MATLAB Function Metric | The Model Maintainability Dashboard provides other MATLAB Maintainability metrics. |
| Model File Count | No replacement |
| Parameter Metric | No replacement |
| Stateflow Chart Metric | The Model Maintainability Dashboard provides other Stateflow Maintainability metrics that are not available in the Metrics Dashboard. |
Architecture Metrics
| Metrics Dashboard Functionality | Use This Instead |
|---|---|
| Cyclomatic Complexity Metric | As part of the transition to the Model Design Dashboards, the cyclomatic complexity metric has been replaced by several new metrics designed to provide a more comprehensive assessment of design complexity. These metrics evaluate the complexity of your design models, charts, and code based on the number of possible execution paths through the design. The metrics calculate design cyclomatic complexity, which is distinct from cyclomatic complexity and other complexity calculations. Unlike previous approaches that relied on a compiled model, which was subject to transformations and optimizations during model compile, these new metrics analyze the graphical representation of the model. This approach allows the Model Maintainability Dashboard to assess the design artifacts that you maintain rather than the intermediate representation of the compiled model. Additionally, the Model Design Dashboard provides Halstead difficulty and complexity metrics with drill-downs to the Model Maintainability Dashboard for detailed analysis. |
| Clone Content Metric | |
| Clone Detection Metric | |
| Library Content Metric |
Compliance Metrics
| Metrics Dashboard Functionality | Use This Instead |
|---|---|
| MATLAB Code Analyzer Warnings | |
| Diagnostic Warnings Metric | |
| Model Advisor Check Compliance for High-Integrity Systems | No replacement. Consider using the Model Guidance Dashboard. |
| Model Advisor Check Compliance for Modeling Standards for MAB | |
| Model Advisor Check Issues for High-Integrity Systems | |
| Model Advisor Check Issues for MAB Standards |
Readability Metrics
| Metric | Description |
|---|---|
| Nondescriptive Block Name Metric | No replacement |
| Data and Structure Layer Separation Metric |
Limitations
The Model Design Dashboard and Model Maintainability Dashboard do not support some capabilities in the Metrics Dashboard.
Dashboard for Subsystem
The Model Design Dashboards cannot open a dashboard directly on a subsystem or display the subsystem metric results in the dashboard widgets. However, when you click a widget in the Model Design or Model Maintainability Dashboard, the app provides a table of detailed metric results for individual Simulink model layers, MATLAB functions and methods, and Stateflow objects. For an example of the detailed metric results in the Model Maintainability Dashboard, see the Metric Details in Monitor Design Complexity Using Model Maintainability Dashboard.
Modeling Guideline Compliance
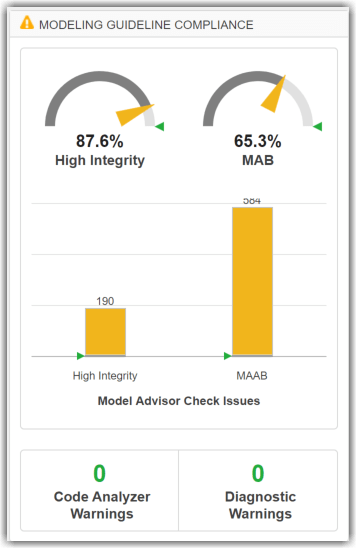
The Model Design Dashboards do not provide compliance metrics for Model Advisor check issues. If you use the Modeling Guideline Compliance group in the Metrics Dashboard, consider using the Model Guidance Dashboard instead.
Actual Reuse and Potential Reuse
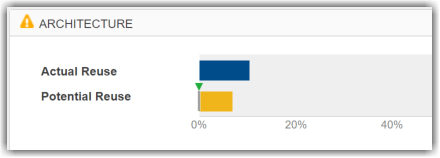
The Model Design Dashboard provides different metrics for reuse. You can identify opportunities for reuse by using the referenced model, linked library, subsystem reference, and Clone Detector results in the Model Design Dashboard. For more information, see Design References and Clone Detection.
Custom Metrics
The Model Design Dashboards do not support custom metrics. If
you have custom metrics, such as MATLAB classes that inherit from the abstract base class
slmetric.metric.Metric and Compliance Metrics for Model Advisor Configurations, contact
MathWorks® Consulting Services for help creating custom metrics for the Model
Design Dashboard and Model Maintainability Dashboard.
Custom Dashboard Layout
The Model Design Dashboards do not support customizing the dashboard layout or other dashboard functionality, such as compliance thresholds. To see an example of the dashboard layout for the Model Design Dashboard and Model Maintainability Dashboard, see Assess Model Design Using Model Design Dashboard and Monitor Design Complexity Using Model Maintainability Dashboard. If you require a different layout for your dashboard widgets, containers, and custom widgets, use the Metrics Dashboard.

