counterfactuals
Syntax
Description
counterExamples = counterfactuals(Mdl,observation)Mdl to return counterfactual
examples for observation. Counterfactual
examples are observations that have minimally different predictor values from
the values of a specified observation, but have different predicted class labels. For more
information, see Counterfactual Examples.
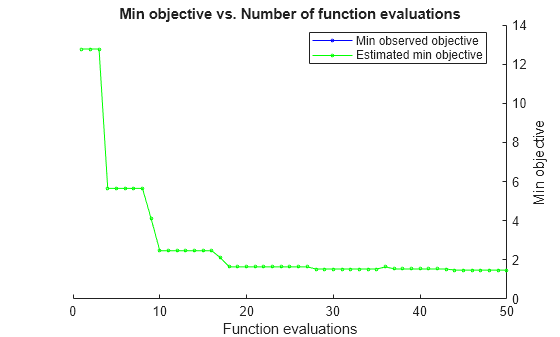
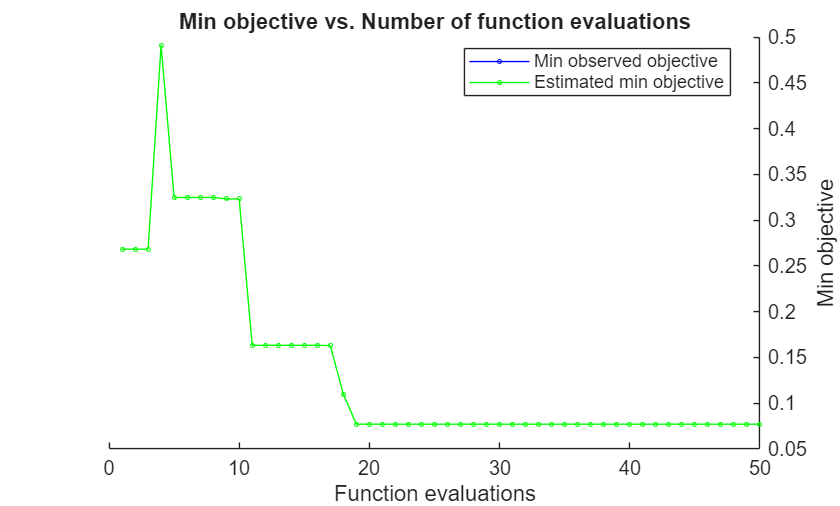
The counterfactuals function uses Bayesian optimization to find and
evaluate counterfactual candidates. The software
displays the optimization results one iteration at a
time. For more information, see Bayesian Optimization.
counterExamples = counterfactuals(Mdl,X,observation)X used to train the compact model
Mdl. You must specify X when the model is
compact; that is, the model does not contain the training data in its properties.
counterExamples = counterfactuals(___,Name=Value)NumCounterfactualExamples and
MaxNumModifiablePredictors
name-value arguments, respectively.
[
also returns counterExamples,metrics] = counterfactuals(___)metrics, which contains additional information about the
counterfactual examples.
Examples
Train a binary neural network classifier to predict whether a corporate customer has a "good" or "poor" credit rating. For a customer who is predicted to have a poor rating, find counterfactual examples by using the counterfactuals function. That is, determine a minimal set of changes to the customer profile that leads to a predicted credit rating of "good."
Read the sample file CreditRating_Historical.dat into a table. The predictor data consists of financial ratios and industry sector information for a list of corporate customers. The response variable consists of credit ratings assigned by a rating agency. Preview the first few rows of the data set.
creditrating = readtable("CreditRating_Historical.dat");
head(creditrating)
ID WC_TA RE_TA EBIT_TA MVE_BVTD S_TA Industry Rating
_____ ______ ______ _______ ________ _____ ________ _______
62394 0.013 0.104 0.036 0.447 0.142 3 {'BB' }
48608 0.232 0.335 0.062 1.969 0.281 8 {'A' }
42444 0.311 0.367 0.074 1.935 0.366 1 {'A' }
48631 0.194 0.263 0.062 1.017 0.228 4 {'BBB'}
43768 0.121 0.413 0.057 3.647 0.466 12 {'AAA'}
39255 -0.117 -0.799 0.01 0.179 0.082 4 {'CCC'}
62236 0.087 0.158 0.049 0.816 0.324 2 {'BBB'}
39354 0.005 0.181 0.034 2.597 0.388 7 {'AA' }
In the Rating response variable, combine the AAA, AA, A, and BBB ratings into a category of "good" ratings, and the BB, B, and CCC ratings into a category of "poor" ratings. Also, convert the Industry variable to a categorical variable.
Rating = categorical(creditrating.Rating);
Rating = mergecats(Rating,["AAA","AA","A","BBB"],"good");
Rating = mergecats(Rating,["BB","B","CCC"],"poor");
creditrating.Rating = Rating;
creditrating.Industry = categorical(creditrating.Industry);
Train a binary neural network classifier using the creditrating data. Specify the Rating column of creditrating as the response, and the WC_TA, RE_TA, EBIT_TA, MVE_BVTD, and S_TA columns as predictors. Standardize the predictors.
predictors = ["WC_TA","RE_TA","EBIT_TA","MVE_BVTD","S_TA"];
rng(0,"twister") % For reproducibility
Mdl = fitcnet(creditrating,"Rating",PredictorNames=predictors, ...
    Standardize=true)
Mdl =
  ClassificationNeuralNetwork
           PredictorNames: {'WC_TA'  'RE_TA'  'EBIT_TA'  'MVE_BVTD'  'S_TA'}
             ResponseName: 'Rating'
    CategoricalPredictors: []
               ClassNames: [good    poor]
           ScoreTransform: 'none'
          NumObservations: 3932
               LayerSizes: 10
              Activations: 'relu'
    OutputLayerActivation: 'softmax'
                   Solver: 'LBFGS'
          ConvergenceInfo: [1×1 struct]
          TrainingHistory: [1000×7 table]


  Properties, Methods
Mdl is a ClassificationNeuralNetwork object. You can use the model object along with its predict function to predict whether a customer has a good credit rating.
Predict the credit rating label for the observations in creditrating. Display the first eight predictions.
predictions = predict(Mdl,creditrating);
head(predictions)
     poor
     good
     good
     good
     good
     poor
     poor
     good
Note that the first observation has a predicted credit rating of poor.
Display the first observation in creditrating.
observation = creditrating(1,:)
observation=1×8 table
     ID      WC_TA    RE_TA    EBIT_TA    MVE_BVTD    S_TA     Industry    Rating
    _____    _____    _____    _______    ________    _____    ________    ______

    62394    0.013    0.104     0.036      0.447      0.142       3         poor
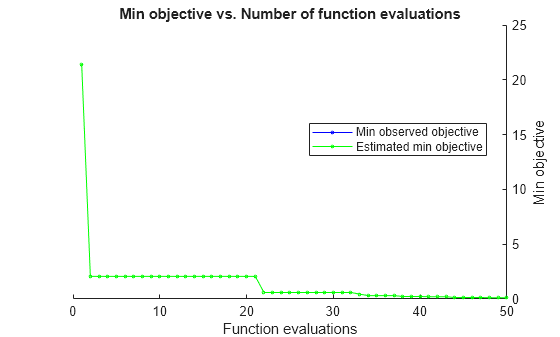
Generate counterfactual examples for the observation (corporate customer with ID 62394). That is, find a minimal set of changes to the predictor values that result in a predicted credit rating of good. By default, the counterfactuals function tries to find 10 counterfactual examples using a Bayesian optimization routine with 50 iterations. The optimization process can take some time.
counterExamples = counterfactuals(Mdl,observation)
|============================================================================================================================================================================================================================================|
| Iter | Eval | Objective | Objective | BestSoFar | BestSoFar | Constraint1 | WC_TA | RE_TA | EBIT_TA | MVE_BVTD | S_TA | WC_TA_Indica-| RE_TA_Indica-| EBIT_TA_Indi-| MVE_BVTD_Ind-| S_TA_Indicat-|
| | result | | runtime | (observed) | (estim.) | violation | | | | | | tor | tor | cator | icator | or |
|============================================================================================================================================================================================================================================|
| 1 | Best | 21.441 | 0.19897 | 21.441 | 21.441 | -0.5 | -0.51929 | 0.104 | -0.57862 | 34.888 | 0.142 | 1 | 0 | 1 | 1 | 0 |
| 2 | Best | 2.0615 | 0.15544 | 2.0615 | 2.0615 | -0.5 | 0.013 | 0.104 | 0.10111 | 0.447 | 0.142 | 0 | 0 | 1 | 0 | 0 |
| 3 | Accept | 4.4134 | 0.028295 | 2.0615 | 2.0615 | -0.5 | 0.013 | 0.104 | 0.036 | 18.334 | 0.142 | 0 | 0 | 0 | 1 | 0 |
| 4 | Accept | 20.642 | 0.029816 | 2.0615 | 2.0615 | -0.5 | 0.013 | 0.104 | 0.036 | 83.407 | 0.7995 | 0 | 0 | 0 | 1 | 1 |
| 5 | Accept | 10.007 | 0.058405 | 2.0615 | 2.0615 | -0.5 | 0.013 | 0.104 | 0.20998 | 34.311 | 0.142 | 0 | 0 | 1 | 1 | 0 |
| 6 | Infeas | 0.018251 | 0.034421 | 2.0615 | 2.0615 | 1 | 0.013 | 0.11025 | 0.036 | 0.447 | 0.142 | 0 | 1 | 0 | 0 | 0 |
| 7 | Infeas | 10.214 | 0.016702 | 2.0615 | 2.0615 | 1 | 0.013 | 0.104 | -0.28662 | 0.447 | 0.142 | 0 | 0 | 1 | 0 | 0 |
| 8 | Infeas | 2.0985 | 0.032377 | 2.0615 | 2.0615 | 1 | 0.013 | 0.104 | -0.030283 | 0.447 | 0.142 | 0 | 0 | 1 | 0 | 0 |
| 9 | Infeas | 0.08673 | 0.013236 | 2.0615 | 2.0615 | 1 | 0.013 | 0.13124 | 0.036 | 0.30677 | 0.142 | 0 | 1 | 0 | 1 | 0 |
| 10 | Infeas | 7.2868 | 0.013283 | 2.0615 | 2.0615 | 1 | 0.013 | -2.3919 | 0.037036 | 0.447 | 0.142 | 0 | 1 | 1 | 0 | 0 |
| 11 | Infeas | 1.4255 | 0.013184 | 2.0615 | 2.0615 | 1 | 0.013 | -0.36746 | 0.047713 | 0.447 | 0.142 | 0 | 1 | 1 | 0 | 0 |
| 12 | Best | 0.60375 | 0.014828 | 0.60375 | 0.60374 | -0.5 | 0.013 | 0.104 | 0.036 | 2.894 | 0.142 | 0 | 0 | 0 | 1 | 0 |
| 13 | Infeas | 27.122 | 0.012322 | 0.60375 | 0.60374 | 1 | -0.58605 | 0.104 | -0.58392 | 0.447 | 4.6782 | 1 | 0 | 1 | 0 | 1 |
| 14 | Accept | 37.65 | 0.01247 | 0.60375 | 0.60376 | -0.5 | -0.18889 | 0.37813 | -0.48565 | 114.62 | 4.7456 | 1 | 1 | 1 | 1 | 1 |
| 15 | Accept | 7.4651 | 0.010486 | 0.60375 | 0.60375 | -0.5 | 0.013 | 0.104 | 0.036 | 0.447 | 1.9808 | 0 | 0 | 0 | 0 | 1 |
| 16 | Accept | 5.793 | 0.009841 | 0.60375 | 0.60375 | -0.5 | -1.0092 | -0.17073 | 0.036 | 0.447 | 0.058686 | 1 | 1 | 0 | 0 | 1 |
| 17 | Accept | 2.346 | 0.015012 | 0.60375 | 0.60375 | -0.5 | -0.33346 | -0.34726 | 0.036 | 0.447 | 0.142 | 1 | 1 | 0 | 0 | 0 |
| 18 | Accept | 4.598 | 0.011147 | 0.60375 | 0.60375 | -0.5 | 0.82979 | -0.048854 | 0.036 | 0.447 | 0.142 | 1 | 1 | 0 | 0 | 0 |
| 19 | Accept | 12.63 | 0.029417 | 0.60375 | 0.60374 | -0.5 | -2.2396 | -0.056853 | 0.036 | 0.447 | 0.142 | 1 | 1 | 0 | 0 | 0 |
| 20 | Infeas | 0.3588 | 0.012426 | 0.60375 | 0.60374 | 1 | 0.013 | 0.104 | 0.036 | 0.447 | 0.05362 | 0 | 0 | 0 | 0 | 1 |
|============================================================================================================================================================================================================================================|
| Iter | Eval | Objective | Objective | BestSoFar | BestSoFar | Constraint1 | WC_TA | RE_TA | EBIT_TA | MVE_BVTD | S_TA | WC_TA_Indica-| RE_TA_Indica-| EBIT_TA_Indi-| MVE_BVTD_Ind-| S_TA_Indicat-|
| | result | | runtime | (observed) | (estim.) | violation | | | | | | tor | tor | cator | icator | or |
|============================================================================================================================================================================================================================================|
| 21 | Infeas | 2.0049 | 0.01158 | 0.60375 | 0.60375 | 1 | 0.013 | -0.57832 | 0.036 | 0.447 | 0.086238 | 0 | 1 | 0 | 0 | 1 |
| 22 | Accept | 5.0033 | 0.011815 | 0.60375 | 0.60375 | -0.5 | 0.013 | 1.7616 | 0.036 | 0.447 | 0.45475 | 0 | 1 | 0 | 0 | 1 |
| 23 | Accept | 1.4742 | 0.011602 | 0.60375 | 0.60375 | -0.5 | -0.024309 | 0.60384 | 0.036 | 0.447 | 0.142 | 1 | 1 | 0 | 0 | 0 |
| 24 | Accept | 14.905 | 0.013749 | 0.60375 | 0.60375 | -0.5 | -2.0346 | -3.1533 | 0.046665 | 0.447 | 0.142 | 1 | 1 | 1 | 0 | 0 |
| 25 | Accept | 26.411 | 0.031492 | 0.60375 | 0.60375 | -0.5 | 0.013 | -3.022 | 0.16492 | 0.447 | 6.1633 | 0 | 1 | 1 | 0 | 1 |
| 26 | Accept | 1.1785 | 0.011299 | 0.60375 | 0.60375 | -0.308 | 0.013 | 0.104 | 0.036 | 0.447 | 0.43229 | 0 | 0 | 0 | 0 | 1 |
| 27 | Infeas | 2.1073e-08 | 0.015184 | 0.60375 | 0.60375 | 1 | 0.013 | 0.104 | 0.036 | 0.447 | 0.142 | 0 | 0 | 0 | 0 | 0 |
| 28 | Infeas | 23.274 | 0.022595 | 0.60375 | 0.60375 | 1 | -1.4216 | -3.1403 | -0.58567 | 0.447 | 0.142 | 1 | 1 | 1 | 0 | 0 |
| 29 | Accept | 6.743 | 0.010295 | 0.60375 | 0.60375 | -0.5 | 0.013 | -1.3044 | 0.20481 | 0.447 | 0.142 | 0 | 1 | 1 | 0 | 0 |
| 30 | Infeas | 0.084776 | 0.018163 | 0.60375 | 0.60374 | 1 | 0.013 | 0.104 | 0.036 | 0.1034 | 0.142 | 0 | 0 | 0 | 1 | 0 |
| 31 | Best | 0.45798 | 0.015477 | 0.45798 | 0.45798 | -0.5 | 0.013 | 0.104 | 0.036 | 2.3032 | 0.142 | 0 | 0 | 0 | 1 | 0 |
| 32 | Best | 0.36688 | 0.009647 | 0.36688 | 0.36708 | -0.498 | 0.013 | 0.104 | 0.036 | 1.934 | 0.142 | 0 | 0 | 0 | 1 | 0 |
| 33 | Accept | 9.2931 | 0.020589 | 0.36688 | 0.36709 | -0.5 | 0.013 | -2.6938 | 0.036 | 18.41 | 0.142 | 0 | 1 | 0 | 1 | 0 |
| 34 | Accept | 6.2804 | 0.023351 | 0.36688 | 0.36711 | -0.5 | 0.013 | 0.104 | 0.1956 | 15.564 | 0.142 | 0 | 0 | 1 | 1 | 0 |
| 35 | Accept | 0.87654 | 0.013457 | 0.36688 | 0.36716 | -0.5 | 0.013 | 0.37682 | 0.036 | 1.9301 | 0.142 | 0 | 1 | 0 | 1 | 0 |
| 36 | Accept | 10.002 | 0.011422 | 0.36688 | 0.36717 | -0.5 | -1.4697 | 0.104 | 0.036 | 23.027 | 0.142 | 1 | 0 | 0 | 1 | 0 |
| 37 | Best | 0.23833 | 0.013492 | 0.23833 | 0.23834 | -0.465 | 0.013 | 0.104 | 0.036 | 1.413 | 0.142 | 0 | 0 | 0 | 1 | 0 |
| 38 | Accept | 3.4994 | 0.012746 | 0.23833 | 0.23831 | -0.5 | 0.013 | -0.8565 | 0.036 | 8.9318 | 0.142 | 0 | 1 | 0 | 1 | 0 |
| 39 | Accept | 7.9442 | 0.014772 | 0.23833 | 0.23831 | -0.5 | 0.82358 | -0.74782 | 0.036 | 24.866 | 0.142 | 1 | 1 | 0 | 1 | 0 |
| 40 | Accept | 8.8394 | 0.022138 | 0.23833 | 0.2383 | -0.5 | 0.813 | 1.6581 | 0.036 | 25.253 | 0.142 | 1 | 1 | 0 | 1 | 0 |
|============================================================================================================================================================================================================================================|
| Iter | Eval | Objective | Objective | BestSoFar | BestSoFar | Constraint1 | WC_TA | RE_TA | EBIT_TA | MVE_BVTD | S_TA | WC_TA_Indica-| RE_TA_Indica-| EBIT_TA_Indi-| MVE_BVTD_Ind-| S_TA_Indicat-|
| | result | | runtime | (observed) | (estim.) | violation | | | | | | tor | tor | cator | icator | or |
|============================================================================================================================================================================================================================================|
| 41 | Best | 0.20465 | 0.010541 | 0.20465 | 0.20467 | -0.422 | 0.013 | 0.10161 | 0.036 | 1.276 | 0.142 | 0 | 1 | 0 | 1 | 0 |
| 42 | Accept | 6.3382 | 0.014062 | 0.20465 | 0.20467 | -0.5 | 0.013 | -0.07536 | -0.13308 | 14.038 | 0.142 | 0 | 1 | 1 | 1 | 0 |
| 43 | Best | 0.16322 | 0.011969 | 0.16322 | 0.1633 | -0.317 | 0.013 | 0.104 | 0.036 | 1.1085 | 0.142 | 0 | 0 | 0 | 1 | 0 |
| 44 | Accept | 14.061 | 0.018662 | 0.16322 | 0.16331 | -0.5 | 0.013 | 0.104 | 0.036 | 21.363 | 3.3639 | 0 | 0 | 0 | 1 | 1 |
| 45 | Accept | 5.5013 | 0.019964 | 0.16322 | 0.16331 | -0.5 | 0.84188 | 0.104 | 0.036 | 12.399 | 0.142 | 1 | 0 | 0 | 1 | 0 |
| 46 | Best | 0.11917 | 0.015724 | 0.11917 | 0.11961 | -0.105 | 0.013 | 0.104 | 0.036 | 0.92998 | 0.142 | 0 | 0 | 0 | 1 | 0 |
| 47 | Accept | 5.5929 | 0.012937 | 0.11917 | 0.11961 | -0.5 | -0.55625 | 1.3073 | 0.036 | 12.447 | 0.142 | 1 | 1 | 0 | 1 | 0 |
| 48 | Infeas | 0.60192 | 0.01776 | 0.11917 | 0.11987 | 1 | 0.013 | -0.096451 | 0.036 | 1.0177 | 0.142 | 0 | 1 | 0 | 1 | 0 |
| 49 | Accept | 4.258 | 0.011838 | 0.11917 | 0.11988 | -0.5 | -0.61708 | 0.104 | 0.036 | 10.097 | 0.142 | 1 | 0 | 0 | 1 | 0 |
| 50 | Infeas | 0.10514 | 0.015607 | 0.11917 | 0.11989 | 1 | -0.0057662 | 0.104 | 0.036 | 0.447 | 0.142 | 1 | 0 | 0 | 0 | 0 |
__________________________________________________________
Optimization completed.
MaxObjectiveEvaluations of 50 reached.
Total function evaluations: 50
Total elapsed time: 52.8185 seconds
Total objective function evaluation time: 1.186
Best observed feasible point:
WC_TA RE_TA EBIT_TA MVE_BVTD S_TA WC_TA_Indicator RE_TA_Indicator EBIT_TA_Indicator MVE_BVTD_Indicator S_TA_Indicator
_____ _____ _______ ________ _____ _______________ _______________ _________________ __________________ ______________
0.013 0.104 0.036 0.92998 0.142 0 0 0 1 0
Observed objective function value = 0.11917
Estimated objective function value = 0.11989
Function evaluation time = 0.015724
Observed constraint violations =[ -0.104738 ]
Best estimated feasible point (according to models):
WC_TA RE_TA EBIT_TA MVE_BVTD S_TA WC_TA_Indicator RE_TA_Indicator EBIT_TA_Indicator MVE_BVTD_Indicator S_TA_Indicator
_____ _____ _______ ________ _____ _______________ _______________ _________________ __________________ ______________
0.013 0.104 0.036 0.92998 0.142 0 0 0 1 0
Estimated objective function value = 0.11989
Estimated function evaluation time = 0.013964
Estimated constraint violations =[ -0.104738 ]
counterExamples=10×5 table
      WC_TA       RE_TA     EBIT_TA    MVE_BVTD     S_TA
    _________    _______    _______    ________    _______

        0.013      0.104     0.036     0.92998       0.142
        0.013      0.104     0.036      1.1085       0.142
        0.013    0.10161     0.036       1.276       0.142
        0.013      0.104     0.036       1.413       0.142
        0.013      0.104     0.036       1.934       0.142
        0.013      0.104     0.036      2.3032       0.142
        0.013      0.104     0.036       2.894       0.142
        0.013    0.37682     0.036      1.9301       0.142
        0.013      0.104     0.036       0.447     0.43229
    -0.024309    0.60384     0.036       0.447       0.142
The counterExamples table contains the predictor data for the counterfactual examples, listed in order of proximity to observation. If the function does not find enough feasible points during the optimization process, the number of counterfactual examples can be less than the default.
Compare the predictor values of observation and the first counterfactual example. Visualize the values (without jitter) using a parallel coordinates plot.
predObservation = observation(:,predictors)
predObservation=1×5 table
    WC_TA    RE_TA    EBIT_TA    MVE_BVTD    S_TA
    _____    _____    _______    ________    _____

    0.013    0.104     0.036      0.447      0.142
predCounterEx = counterExamples(1,:)
predCounterEx=1×5 table
    WC_TA    RE_TA    EBIT_TA    MVE_BVTD    S_TA
    _____    _____    _______    ________    _____

    0.013    0.104     0.036     0.92998     0.142
parallelplot([predObservation;predCounterEx],Jitter=0)
ylabel("Predictor Value")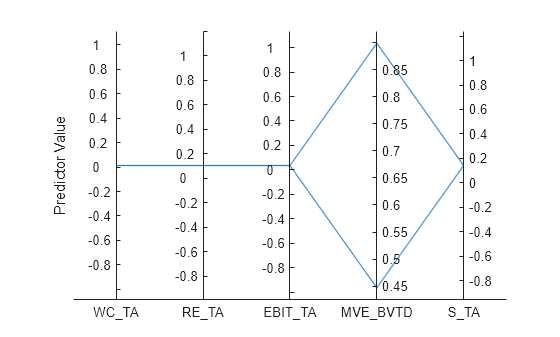
The counterfactual example has a greater MVE_BVTD value than observation. This change in predictor value leads to a different credit rating prediction.
observationLabel = predict(Mdl,observation)
observationLabel = categorical
     poor
counterExLabel = predict(Mdl,predCounterEx)
counterExLabel = categorical
     good
Train a binary neural network classifier to predict whether an individual makes over $50,000 per year. For an individual who is predicted to have a yearly salary of $50,000 or less, find counterfactual examples by using the counterfactuals function. That is, determine a minimal set of changes to the individual's profile that leads to a predicted yearly salary of over $50,000. Visually compare the changes by using a glyph plot.
Load the 1994 census data stored in census1994.mat. The data set consists of demographic information from the US Census Bureau, split into a training data set adultdata and a test data set adulttest. Preview the first few rows of the training data set.
load census1994
head(adultdata)
age workClass fnlwgt education education_num marital_status occupation relationship race sex capital_gain capital_loss hours_per_week native_country salary
___ ________________ __________ _________ _____________ _____________________ _________________ _____________ _____ ______ ____________ ____________ ______________ ______________ ______
39 State-gov 77516 Bachelors 13 Never-married Adm-clerical Not-in-family White Male 2174 0 40 United-States <=50K
50 Self-emp-not-inc 83311 Bachelors 13 Married-civ-spouse Exec-managerial Husband White Male 0 0 13 United-States <=50K
38 Private 2.1565e+05 HS-grad 9 Divorced Handlers-cleaners Not-in-family White Male 0 0 40 United-States <=50K
53 Private 2.3472e+05 11th 7 Married-civ-spouse Handlers-cleaners Husband Black Male 0 0 40 United-States <=50K
28 Private 3.3841e+05 Bachelors 13 Married-civ-spouse Prof-specialty Wife Black Female 0 0 40 Cuba <=50K
37 Private 2.8458e+05 Masters 14 Married-civ-spouse Exec-managerial Wife White Female 0 0 40 United-States <=50K
49 Private 1.6019e+05 9th 5 Married-spouse-absent Other-service Not-in-family Black Female 0 0 16 Jamaica <=50K
52 Self-emp-not-inc 2.0964e+05 HS-grad 9 Married-civ-spouse Exec-managerial Husband White Male 0 0 45 United-States >50K
Each row contains the demographic information for one adult. The last column, salary, shows whether a person has a salary less than or equal to $50,000 per year or greater than $50,000 per year.
Delete the rows of adultdata in which the table has missing values.
adultdata = rmmissing(adultdata);
Because education and education_num contain similar information, remove the nonnumeric education variable from adultdata.
adultdata.education = [];
Train a binary neural network classifier using adultdata. Specify the salary column of adultdata as the response and the fnlwgt column as the observation weights.Standardize the numeric predictors.
rng(0,"twister")
Mdl = fitcnet(adultdata,"salary","Weights","fnlwgt", ...
    Standardize=true)
Mdl =
  ClassificationNeuralNetwork
           PredictorNames: {'age'  'workClass'  'education_num'  'marital_status'  'occupation'  'relationship'  'race'  'sex'  'capital_gain'  'capital_loss'  'hours_per_week'  'native_country'}
             ResponseName: 'salary'
    CategoricalPredictors: [2 4 5 6 7 8 12]
               ClassNames: [<=50K    >50K]
           ScoreTransform: 'none'
          NumObservations: 30162
               LayerSizes: 10
              Activations: 'relu'
    OutputLayerActivation: 'softmax'
                   Solver: 'LBFGS'
          ConvergenceInfo: [1×1 struct]
          TrainingHistory: [1000×7 table]


  Properties, Methods
Mdl is a ClassificationNeuralNetwork object. You can use the model object along with its predict function to predict whether an individual makes over $50,000 per year.
Display the first observation in adultdata. Determine the predicted salary for the individual whose demographic information is in observation.
observation = adultdata(1,:)
observation=1×14 table
    age    workClass    fnlwgt    education_num    marital_status     occupation     relationship     race     sex     capital_gain    capital_loss    hours_per_week    native_country    salary
    ___    _________    ______    _____________    ______________    ____________    _____________    _____    ____    ____________    ____________    ______________    ______________    ______

    39     State-gov    77516          13          Never-married     Adm-clerical    Not-in-family    White    Male        2174             0                40          United-States     <=50K
label = predict(Mdl,observation)
label = categorical
     <=50K
The predicted salary for the individual is less than or equal to $50,000 per year.
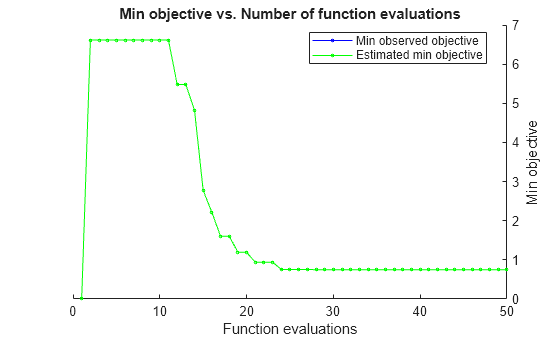
Generate counterfactual examples for observation. That is, find a minimal set of changes to the predictor values of observation that result in a predicted salary of over $50,000 per year. Specify education_num, capital_gain, capital_loss, and hours_per_week as the only predictors whose values can be modified. By default, the counterfactuals function tries to find 10 counterfactual examples using a Bayesian optimization routine with 50 iterations. The optimization process can take some time.
modPredictors = ["education_num","capital_gain", ...
    "capital_loss","hours_per_week"];
counterExamples = counterfactuals(Mdl,observation, ...
    ModifiablePredictors=modPredictors)
|==============================================================================================================================================================================================================|
| Iter | Eval | Objective | Objective | BestSoFar | BestSoFar | Constraint1 | education_num| capital_gain | capital_loss | hours_per_we-| education_nu-| capital_gain-| capital_loss-| hours_per_we-|
| | result | | runtime | (observed) | (estim.) | violation | | | | ek | m_Indicator | _Indicator | _Indicator | ek_Indicator |
|==============================================================================================================================================================================================================|
| 1 | Infeas | 0 | 0.093781 | NaN | 0 | 1 | 13 | 2174 | 0 | 40 | 0 | 0 | 0 | 0 |
| 2 | Best | 6.6149 | 0.064469 | 6.6149 | 6.6149 | -0.5 | 11 | 47761 | 926.81 | 40 | 1 | 1 | 1 | 0 |
| 3 | Accept | 12.289 | 0.01475 | 6.6149 | 6.6149 | -0.5 | 13 | 88911 | 1505.5 | 40 | 0 | 1 | 1 | 0 |
| 4 | Infeas | 0.16695 | 0.014964 | 6.6149 | 6.6149 | 1 | 13 | 2174 | 0 | 38 | 0 | 0 | 0 | 1 |
| 5 | Infeas | 5.1104 | 0.029595 | 6.6149 | 6.6149 | 1 | 2 | 497.18 | 1051.1 | 50 | 1 | 1 | 1 | 1 |
| 6 | Infeas | 4.7059 | 0.007006 | 6.6149 | 6.6149 | 1 | 1 | 2174 | 0 | 40 | 1 | 0 | 0 | 0 |
| 7 | Infeas | 4.925 | 0.006902 | 6.6149 | 6.6149 | 1 | 13 | 2174 | 0 | 99 | 0 | 0 | 0 | 1 |
| 8 | Infeas | 6.0187 | 0.007351 | 6.6149 | 6.6149 | 1 | 10 | 598.95 | 1312.5 | 99 | 1 | 1 | 1 | 1 |
| 9 | Infeas | 4.943 | 0.008545 | 6.6149 | 6.6149 | 1 | 2 | 10.236 | 968.61 | 40 | 1 | 1 | 1 | 0 |
| 10 | Infeas | 10.246 | 0.006535 | 6.6149 | 6.6149 | 1 | 13 | 167.17 | 3958.5 | 4 | 1 | 1 | 1 | 1 |
| 11 | Infeas | 0.25984 | 0.007306 | 6.6149 | 6.6149 | 1 | 13 | 1484 | 98.068 | 40 | 1 | 1 | 1 | 0 |
| 12 | Best | 5.4807 | 0.007704 | 5.4807 | 5.4807 | -0.5 | 16 | 38414 | 0 | 66 | 1 | 1 | 0 | 1 |
| 13 | Infeas | 0.8783 | 0.007478 | 5.4807 | 5.4807 | 1 | 13 | 5543.7 | 0 | 49 | 0 | 1 | 0 | 1 |
| 14 | Best | 4.8239 | 0.008009 | 4.8239 | 4.8239 | -0.5 | 15 | 30473 | 0 | 6 | 1 | 1 | 0 | 1 |
| 15 | Best | 2.7702 | 0.007015 | 2.7702 | 2.7702 | -0.5 | 14 | 22484 | 0 | 40 | 1 | 1 | 0 | 0 |
| 16 | Best | 2.2114 | 0.006234 | 2.2114 | 2.2114 | -0.492 | 11 | 17487 | 0 | 40 | 1 | 1 | 0 | 0 |
| 17 | Best | 1.6072 | 0.006592 | 1.6072 | 1.6072 | -0.483 | 14 | 13717 | 0 | 40 | 1 | 1 | 0 | 0 |
| 18 | Infeas | 1.1885 | 0.016973 | 1.6072 | 1.6072 | 1 | 16 | 925.03 | 0 | 40 | 1 | 1 | 0 | 0 |
| 19 | Infeas | 0.060194 | 0.007593 | 1.6072 | 1.6072 | 1 | 13 | 2174 | 24.336 | 40 | 0 | 0 | 1 | 0 |
| 20 | Best | 1.3798 | 0.006727 | 1.3798 | 1.3798 | -0.408 | 14 | 10863 | 237.74 | 38 | 1 | 1 | 1 | 1 |
|==============================================================================================================================================================================================================|
| Iter | Eval | Objective | Objective | BestSoFar | BestSoFar | Constraint1 | education_num| capital_gain | capital_loss | hours_per_we-| education_nu-| capital_gain-| capital_loss-| hours_per_we-|
| | result | | runtime | (observed) | (estim.) | violation | | | | ek | m_Indicator | _Indicator | _Indicator | ek_Indicator |
|==============================================================================================================================================================================================================|
| 21 | Best | 0.95657 | 0.008047 | 0.95657 | 0.95657 | -0.0843 | 12 | 8635.9 | 0 | 40 | 1 | 1 | 0 | 0 |
| 22 | Best | 0.93429 | 0.006956 | 0.93429 | 0.93429 | -0.134 | 13 | 8394.9 | 165.4 | 40 | 1 | 1 | 1 | 0 |
| 23 | Best | 0.81141 | 0.006858 | 0.81141 | 0.81141 | -0.129 | 13 | 8183.5 | 0 | 40 | 1 | 1 | 0 | 0 |
| 24 | Best | 0.75636 | 0.006962 | 0.75636 | 0.75637 | -0.0654 | 13 | 7775.8 | 0 | 40 | 0 | 1 | 0 | 0 |
| 25 | Best | 0.72736 | 0.00661 | 0.72736 | 0.72749 | -0.0311 | 13 | 7561 | 0 | 40 | 0 | 1 | 0 | 0 |
| 26 | Infeas | 2.1275 | 0.006877 | 0.72736 | 0.7275 | 1 | 13 | 7476.4 | 0 | 16 | 0 | 1 | 0 | 1 |
| 27 | Accept | 7.6864 | 0.007332 | 0.72736 | 0.7275 | -0.5 | 3 | 35513 | 0 | 98 | 1 | 1 | 0 | 1 |
| 28 | Infeas | 0.46236 | 0.006067 | 0.72736 | 0.72717 | 1 | 13 | 5598.4 | 0 | 40 | 0 | 1 | 0 | 0 |
| 29 | Infeas | 1.6431 | 0.005871 | 0.72736 | 0.72732 | 1 | 13 | 7499.9 | 597.3 | 40 | 0 | 1 | 1 | 0 |
| 30 | Infeas | 0.25475 | 0.012446 | 0.72736 | 0.72727 | 1 | 13 | 287.28 | 0 | 40 | 0 | 1 | 0 | 1 |
| 31 | Best | 0.71077 | 0.006308 | 0.71077 | 0.71068 | -0.0113 | 13 | 7438.1 | 0 | 40 | 0 | 1 | 0 | 0 |
| 32 | Accept | 7.2724 | 0.00907 | 0.71077 | 0.71067 | -0.485 | 1 | 35854 | 0 | 2 | 1 | 1 | 0 | 1 |
| 33 | Infeas | 0.69999 | 0.006087 | 0.71077 | 0.71074 | 1 | 13 | 7358.3 | 0 | 40 | 0 | 1 | 0 | 0 |
| 34 | Infeas | 0.13715 | 0.006587 | 0.71077 | 0.71073 | 1 | 13 | 1158.2 | 0 | 40 | 0 | 1 | 0 | 0 |
| 35 | Accept | 11.134 | 0.006353 | 0.71077 | 0.71073 | -0.5 | 1 | 75161 | 0 | 14 | 1 | 1 | 0 | 1 |
| 36 | Infeas | 0.062312 | 0.005772 | 0.71077 | 0.71076 | 1 | 13 | 1712.5 | 0 | 40 | 1 | 1 | 0 | 0 |
| 37 | Accept | 0.81122 | 0.006107 | 0.71077 | 0.71074 | -0.128 | 13 | 8182.1 | 0 | 40 | 0 | 1 | 0 | 0 |
| 38 | Best | 0.71072 | 0.005787 | 0.71072 | 0.71069 | -0.0112 | 13 | 7437.7 | 0 | 40 | 0 | 1 | 0 | 0 |
| 39 | Accept | 0.7566 | 0.006154 | 0.71072 | 0.7107 | -0.0657 | 13 | 7777.6 | 0 | 40 | 1 | 1 | 0 | 0 |
| 40 | Infeas | 0.034306 | 0.007567 | 0.71072 | 0.7107 | 1 | 13 | 1919.9 | 0 | 40 | 0 | 1 | 0 | 0 |
|==============================================================================================================================================================================================================|
| Iter | Eval | Objective | Objective | BestSoFar | BestSoFar | Constraint1 | education_num| capital_gain | capital_loss | hours_per_we-| education_nu-| capital_gain-| capital_loss-| hours_per_we-|
| | result | | runtime | (observed) | (estim.) | violation | | | | ek | m_Indicator | _Indicator | _Indicator | ek_Indicator |
|==============================================================================================================================================================================================================|
| 41 | Infeas | 0.51394 | 0.00604 | 0.71072 | 0.7107 | 1 | 13 | 1320.2 | 0 | 46 | 0 | 1 | 0 | 1 |
| 42 | Infeas | 0.081811 | 0.007199 | 0.71072 | 0.71072 | 1 | 13 | 2779.9 | 0 | 40 | 0 | 1 | 0 | 0 |
| 43 | Infeas | 0.17042 | 0.006741 | 0.71072 | 0.71072 | 1 | 13 | 2427.7 | 0 | 42 | 0 | 1 | 0 | 1 |
| 44 | Accept | 0.75616 | 0.006033 | 0.71072 | 0.71072 | -0.0652 | 13 | 7774.3 | 0 | 40 | 1 | 1 | 0 | 0 |
| 45 | Accept | 0.75692 | 0.005942 | 0.71072 | 0.71072 | -0.0661 | 13 | 7779.9 | 0 | 40 | 0 | 1 | 0 | 0 |
| 46 | Infeas | 0.0039516 | 0.006643 | 0.71072 | 0.71073 | 1 | 13 | 2144.7 | 0 | 40 | 0 | 1 | 0 | 0 |
| 47 | Infeas | 0.39251 | 0.007089 | 0.71072 | 0.71073 | 1 | 12 | 2298.1 | 0 | 40 | 1 | 1 | 0 | 0 |
| 48 | Infeas | 0.055937 | 0.00982 | 0.71072 | 0.71071 | 1 | 13 | 2588.3 | 0 | 40 | 0 | 1 | 0 | 0 |
| 49 | Infeas | 0.45148 | 0.006308 | 0.71072 | 0.71072 | 1 | 14 | 3830.8 | 0 | 40 | 1 | 1 | 0 | 0 |
| 50 | Infeas | 0.14347 | 0.006208 | 0.71072 | 0.71072 | 1 | 13 | 3236.6 | 0 | 40 | 0 | 1 | 0 | 0 |
__________________________________________________________
Optimization completed.
MaxObjectiveEvaluations of 50 reached.
Total function evaluations: 50
Total elapsed time: 18.33 seconds
Total objective function evaluation time: 0.54337
Best observed feasible point:
education_num capital_gain capital_loss hours_per_week education_num_Indicator capital_gain_Indicator capital_loss_Indicator hours_per_week_Indicator
_____________ ____________ ____________ ______________ _______________________ ______________________ ______________________ ________________________
13 7437.7 0 40 0 1 0 0
Observed objective function value = 0.71072
Estimated objective function value = 0.71072
Function evaluation time = 0.005787
Observed constraint violations =[ -0.011247 ]
Best estimated feasible point (according to models):
education_num capital_gain capital_loss hours_per_week education_num_Indicator capital_gain_Indicator capital_loss_Indicator hours_per_week_Indicator
_____________ ____________ ____________ ______________ _______________________ ______________________ ______________________ ________________________
13 7437.7 0 40 0 1 0 0
Estimated objective function value = 0.71072
Estimated function evaluation time = 0.0065008
Estimated constraint violations =[ -0.011249 ]
counterExamples=10×12 table
    age    workClass    education_num    marital_status     occupation     relationship     race     sex     capital_gain    capital_loss    hours_per_week    native_country
    ___    _________    _____________    ______________    ____________    _____________    _____    ____    ____________    ____________    ______________    ______________

    39     State-gov         13          Never-married     Adm-clerical    Not-in-family    White    Male       7437.7              0              40          United-States
    39     State-gov         13          Never-married     Adm-clerical    Not-in-family    White    Male       7438.1              0              40          United-States
    39     State-gov         13          Never-married     Adm-clerical    Not-in-family    White    Male         7561              0              40          United-States
    39     State-gov         13          Never-married     Adm-clerical    Not-in-family    White    Male       7774.3              0              40          United-States
    39     State-gov         13          Never-married     Adm-clerical    Not-in-family    White    Male       7775.8              0              40          United-States
    39     State-gov         13          Never-married     Adm-clerical    Not-in-family    White    Male       7777.6              0              40          United-States
    39     State-gov         13          Never-married     Adm-clerical    Not-in-family    White    Male       7779.9              0              40          United-States
    39     State-gov         13          Never-married     Adm-clerical    Not-in-family    White    Male       8182.1              0              40          United-States
    39     State-gov         13          Never-married     Adm-clerical    Not-in-family    White    Male       8183.5              0              40          United-States
    39     State-gov         13          Never-married     Adm-clerical    Not-in-family    White    Male       8394.9          165.4              40          United-States
The counterExamples table contains the predictor data for the counterfactual examples, listed in order of proximity to observation. If the function does not find enough feasible points during the optimization process, the number of counterfactual examples can be less than the default.
Gather into one table the modifiable predictor values for observation and the observations in counterExamples.
observationPred = observation(:,modPredictors);
counterExamplesPred = counterExamples(:,modPredictors);
allObservationsPred = [observationPred;counterExamplesPred]
allObservationsPred=11×4 table
    education_num    capital_gain    capital_loss    hours_per_week
    _____________    ____________    ____________    ______________

         13               2174              0              40
         13             7437.7              0              40
         13             7438.1              0              40
         13               7561              0              40
         13             7774.3              0              40
         13             7775.8              0              40
         13             7777.6              0              40
         13             7779.9              0              40
         13             8182.1              0              40
         13             8183.5              0              40
         13             8394.9          165.4              40
The first four counterfactual examples differ from observation in only one predictor (capital_gain).
Visually compare the modifiable predictor values by using a star plot (glyph plot). A star plot represents each observation as a star, in which spoke i is proportional in length to the value of predictor i for that observation. By default, glyphplot standardizes the predictors before plotting.
labels = ["observation"; ...
    repmat("counterEx",size(counterExamples,1),1)];
glyphplot(allObservationsPred{:,:},ObsLabels=labels, ...
    VarLabels=modPredictors)
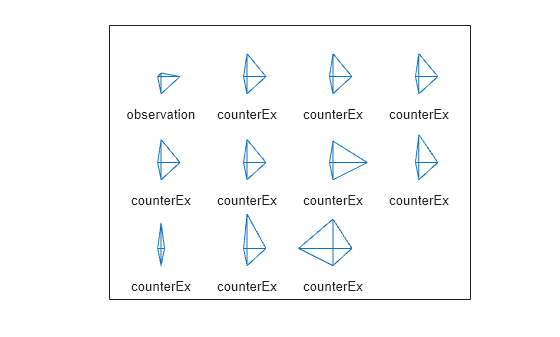
The first four counterfactual examples have very similar stars (glyphs), indicating that the observations have similar predictor values. For three of the four star spokes, the stars also resemble the observation star. This result indicates that the four counterfactual examples mostly differ from observation in one predictor. Because the fourth spoke is longer for the stars of the counterfactual examples, the predictor value is greater for those observations.
Train a support vector machine (SVM) classifier to predict whether an individual makes over $50,000 per year. For an individual who is predicted to have a yearly salary of $50,000 or less, find counterfactual examples by using the counterfactuals function. That is, determine a minimal set of changes to the individual's profile that leads to a predicted yearly salary of over $50,000. Ensure that none of the counterfactual examples are anomalies by using a one-class SVM anomaly detection model.
Load the 1994 census data stored in census1994.mat. The data set consists of demographic information from the US Census Bureau, split into a training data set adultdata and a test data set adulttest. Preview the first few rows of the training data set.
load census1994
head(adultdata)
age workClass fnlwgt education education_num marital_status occupation relationship race sex capital_gain capital_loss hours_per_week native_country salary
___ ________________ __________ _________ _____________ _____________________ _________________ _____________ _____ ______ ____________ ____________ ______________ ______________ ______
39 State-gov 77516 Bachelors 13 Never-married Adm-clerical Not-in-family White Male 2174 0 40 United-States <=50K
50 Self-emp-not-inc 83311 Bachelors 13 Married-civ-spouse Exec-managerial Husband White Male 0 0 13 United-States <=50K
38 Private 2.1565e+05 HS-grad 9 Divorced Handlers-cleaners Not-in-family White Male 0 0 40 United-States <=50K
53 Private 2.3472e+05 11th 7 Married-civ-spouse Handlers-cleaners Husband Black Male 0 0 40 United-States <=50K
28 Private 3.3841e+05 Bachelors 13 Married-civ-spouse Prof-specialty Wife Black Female 0 0 40 Cuba <=50K
37 Private 2.8458e+05 Masters 14 Married-civ-spouse Exec-managerial Wife White Female 0 0 40 United-States <=50K
49 Private 1.6019e+05 9th 5 Married-spouse-absent Other-service Not-in-family Black Female 0 0 16 Jamaica <=50K
52 Self-emp-not-inc 2.0964e+05 HS-grad 9 Married-civ-spouse Exec-managerial Husband White Male 0 0 45 United-States >50K
Each row contains the demographic information for one adult. The last column, salary, shows whether a person has a salary less than or equal to $50,000 per year or greater than $50,000 per year.
Delete the rows of adultdata and adulttest in which the table has missing values.
adultdata = rmmissing(adultdata);
adulttest = rmmissing(adulttest);
Because education and education_num contain similar information, remove the nonnumeric education variable from adultdata and adulttest.
adultdata.education = [];
adulttest.education = [];
Train an SVM classifier using adultdata. Specify the salary column of adultdata as the response and the fnlwgt column as the observation weights. Standardize the numeric predictors.
rng(0,"twister")
Mdl = fitcsvm(adultdata,"salary","Weights","fnlwgt", ...
    Standardize=true)
Mdl =
  ClassificationSVM
           PredictorNames: {'age'  'workClass'  'education_num'  'marital_status'  'occupation'  'relationship'  'race'  'sex'  'capital_gain'  'capital_loss'  'hours_per_week'  'native_country'}
             ResponseName: 'salary'
    CategoricalPredictors: [2 4 5 6 7 8 12]
               ClassNames: [<=50K    >50K]
           ScoreTransform: 'none'
          NumObservations: 30162
                    Alpha: [10688×1 double]
                     Bias: -2.0469
         KernelParameters: [1×1 struct]
                       Mu: [37.8785 0 0 0 0 0 0 0 10.0574 0 0 0 0 0 0 0 0 0 0 0 0 0 0 0 0 0 0 0 0 0 0 0 0 0 0 0 0 0 0 0 0 0 0 1.0937e+03 86.1783 40.7786 0 0 0 0 0 0 0 0 0 0 0 0 0 0 0 0 0 0 0 0 0 0 0 0 0 0 0 0 0 0 0 0 0 0 0 0 0 0 0 0 0]
                    Sigma: [12.9860 1 1 1 1 1 1 1 2.5957 1 1 1 1 1 1 1 1 1 1 1 1 1 1 1 1 1 1 1 1 1 1 1 1 1 1 1 1 1 1 1 1 1 1 7.4580e+03 398.9456 11.7554 1 1 1 1 1 1 1 1 1 1 1 1 1 1 1 1 1 1 1 1 1 1 1 1 1 1 1 1 1 1 1 1 1 1 1 1 1 1 1 1 1]
           BoxConstraints: [30162×1 double]
          ConvergenceInfo: [1×1 struct]
          IsSupportVector: [30162×1 logical]
                   Solver: 'SMO'


  Properties, Methods
Mdl is a ClassificationSVM object. You can use the model object along with its predict function to predict whether an individual makes over $50,000 per year.
Display the third observation in adultdata. Determine the predicted salary for the individual whose demographic information is in observation.
observation = adultdata(3,:)
observation=1×14 table
    age    workClass      fnlwgt      education_num    marital_status       occupation        relationship     race     sex     capital_gain    capital_loss    hours_per_week    native_country    salary
    ___    _________    __________    _____________    ______________    _________________    _____________    _____    ____    ____________    ____________    ______________    ______________    ______

    38      Private     2.1565e+05          9             Divorced       Handlers-cleaners    Not-in-family    White    Male         0               0                40          United-States     <=50K
label = predict(Mdl,observation)
label = categorical
     <=50K
The predicted salary for the individual is less than or equal to $50,000 per year.
Before finding counterfactual examples for observation, train a one-class SVM model for anomaly detection. Assume that adulttest does not contain outliers. Specify StandardizeData as true to standardize the data, and set KernelScale to "auto" to let the function select an appropriate kernel scale parameter using a heuristic procedure. Use the same predictors as those used to train the classifier Mdl.
anomalyMdl = ocsvm(adulttest,StandardizeData=true, ...
    KernelScale="auto",PredictorNames=Mdl.PredictorNames)
anomalyMdl =
  OneClassSVM

    CategoricalPredictors: [2 4 5 6 7 8 12]
    ContaminationFraction: 0
           ScoreThreshold: 0.0159
           PredictorNames: {'age'  'workClass'  'education_num'  'marital_status'  'occupation'  'relationship'  'race'  'sex'  'capital_gain'  'capital_loss'  'hours_per_week'  'native_country'}
              KernelScale: 3.5942
                   Lambda: 0.1535


  Properties, Methods
anomalyMdl is a OneClassSVM object. You can use the model object along with its isanomaly function to determine whether an observation is an anomaly.
Generate counterfactual examples for observation. That is, find a minimal set of changes to the predictor values of observation that result in a predicted salary of over $50,000 per year. Specify education_num, capital_gain, capital_loss, and hours_per_week as the only predictors whose values can be modified. Use the anomaly detection model anomalyMdl to ensure that none of the counterfactual examples are anomalies. By default, the counterfactuals function tries to find 10 counterfactual examples using a Bayesian optimization routine with 50 iterations. The optimization process can take some time.
modPredictors = ["education_num","capital_gain", ...
    "capital_loss","hours_per_week"];
counterExamples = counterfactuals(Mdl,observation, ...
    ModifiablePredictors=modPredictors,AnomalyModel=anomalyMdl)
|==============================================================================================================================================================================================================|
| Iter | Eval | Objective | Objective | BestSoFar | BestSoFar | Constraint1 | education_num| capital_gain | capital_loss | hours_per_we-| education_nu-| capital_gain-| capital_loss-| hours_per_we-|
| | result | | runtime | (observed) | (estim.) | violation | | | | ek | m_Indicator | _Indicator | _Indicator | ek_Indicator |
|==============================================================================================================================================================================================================|
| 1 | Best | 12.773 | 0.1105 | 12.773 | 12.773 | -20.6 | 15 | 92979 | 0 | 40 | 1 | 1 | 0 | 0 |
| 2 | Infeas | 4.617 | 0.046559 | 12.773 | 12.773 | 1 | 2 | 0 | 493.39 | 82 | 1 | 0 | 1 | 1 |
| 3 | Infeas | 3.6867 | 0.039946 | 12.773 | 12.773 | 1 | 15 | 0 | 0 | 74 | 1 | 0 | 0 | 1 |
| 4 | Best | 5.6532 | 0.027299 | 5.6532 | 5.6532 | -4.29 | 9 | 26173 | 1783.9 | 40 | 0 | 1 | 1 | 0 |
| 5 | Accept | 9.9227 | 0.041819 | 5.6532 | 5.6532 | -6.81 | 12 | 27158 | 3177.7 | 96 | 1 | 1 | 1 | 1 |
| 6 | Accept | 12.611 | 0.013526 | 5.6532 | 5.6532 | -18.7 | 6 | 92989 | 0 | 40 | 1 | 1 | 0 | 0 |
| 7 | Accept | 12.099 | 0.01333 | 5.6532 | 5.6532 | -6.62 | 9 | 27320 | 4355.2 | 89 | 0 | 1 | 1 | 1 |
| 8 | Best | 3.5797 | 0.012938 | 3.5797 | 3.5797 | -3.84 | 11 | 25868 | 0 | 40 | 1 | 1 | 0 | 0 |
| 9 | Accept | 4.0567 | 0.014301 | 3.5797 | 3.5797 | -3.89 | 9 | 25765 | 0 | 65 | 0 | 1 | 0 | 1 |
| 10 | Accept | 11.623 | 0.014085 | 3.5797 | 3.5797 | -7.28 | 16 | 24503 | 3982.8 | 93 | 1 | 1 | 1 | 1 |
| 11 | Accept | 3.9952 | 0.01334 | 3.5797 | 3.5797 | -0.115 | 14 | 10612 | 20.353 | 2 | 1 | 1 | 1 | 1 |
| 12 | Best | 1.6376 | 0.013058 | 1.6376 | 1.6376 | -0.231 | 11 | 10647 | 0 | 40 | 1 | 1 | 0 | 0 |
| 13 | Accept | 14.593 | 0.013767 | 1.6376 | 1.6376 | -20.4 | 1 | 99923 | 0 | 95 | 1 | 1 | 0 | 1 |
| 14 | Accept | 2.8847 | 0.012678 | 1.6376 | 1.6376 | -0.275 | 16 | 6565.5 | 0 | 40 | 1 | 1 | 0 | 0 |
| 15 | Accept | 2.8923 | 0.012347 | 1.6376 | 1.6376 | -0.0225 | 4 | 15747 | 0 | 40 | 1 | 1 | 0 | 0 |
| 16 | Infeas | 0 | 0.021534 | 1.6376 | 1.6376 | 1 | 9 | 0 | 0 | 40 | 0 | 0 | 0 | 0 |
| 17 | Best | 1.5445 | 0.013239 | 1.5445 | 1.5445 | -0.0134 | 9 | 11439 | 0 | 40 | 0 | 1 | 0 | 0 |
| 18 | Infeas | 3.0567 | 0.012123 | 1.5445 | 1.5445 | 1 | 9 | 0 | 1197.9 | 31 | 0 | 0 | 1 | 1 |
| 19 | Infeas | 1.4788 | 0.013821 | 1.5445 | 1.5445 | 1 | 11 | 9284.6 | 0 | 40 | 1 | 1 | 0 | 0 |
| 20 | Infeas | 1.6696 | 0.011273 | 1.5445 | 1.5445 | 1 | 9 | 174.45 | 0 | 20 | 0 | 1 | 0 | 1 |
|==============================================================================================================================================================================================================|
| Iter | Eval | Objective | Objective | BestSoFar | BestSoFar | Constraint1 | education_num| capital_gain | capital_loss | hours_per_we-| education_nu-| capital_gain-| capital_loss-| hours_per_we-|
| | result | | runtime | (observed) | (estim.) | violation | | | | ek | m_Indicator | _Indicator | _Indicator | ek_Indicator |
|==============================================================================================================================================================================================================|
| 21 | Infeas | 1.2374 | 0.015104 | 1.5445 | 1.5445 | 1 | 12 | 2840.2 | 0 | 40 | 1 | 1 | 0 | 0 |
| 22 | Accept | 1.5651 | 0.017295 | 1.5445 | 1.5445 | -0.0631 | 9 | 11509 | 75.458 | 40 | 0 | 1 | 1 | 0 |
| 23 | Accept | 1.5588 | 0.011606 | 1.5445 | 1.5445 | -0.0385 | 9 | 11544 | 0 | 40 | 1 | 1 | 0 | 0 |
| 24 | Infeas | 4.4614 | 0.016457 | 1.5445 | 1.5445 | 1 | 1 | 0 | 0 | 2 | 1 | 0 | 0 | 1 |
| 25 | Infeas | 1.2535 | 0.011078 | 1.5445 | 1.5446 | 1 | 6 | 3203.3 | 0 | 40 | 1 | 1 | 0 | 0 |
| 26 | Infeas | 1.0466 | 0.012876 | 1.5445 | 1.5446 | 1 | 11 | 5132.2 | 0 | 40 | 1 | 1 | 0 | 0 |
| 27 | Infeas | 0.88339 | 0.01173 | 1.5445 | 1.5443 | 1 | 9 | 6542.6 | 0 | 40 | 0 | 1 | 0 | 0 |
| 28 | Infeas | 0.21054 | 0.012316 | 1.5445 | 1.5445 | 1 | 9 | 1559.3 | 0 | 40 | 0 | 1 | 0 | 0 |
| 29 | Infeas | 1.9326 | 0.020743 | 1.5445 | 1.5445 | 1 | 9 | 2369.3 | 770.56 | 40 | 0 | 1 | 1 | 0 |
| 30 | Infeas | 1.3775 | 0.03174 | 1.5445 | 1.5445 | 1 | 9 | 10202 | 0 | 40 | 0 | 1 | 0 | 0 |
| 31 | Accept | 16.869 | 0.011555 | 1.5445 | 1.5445 | -20.2 | 2 | 94543 | 4318.2 | 40 | 1 | 1 | 1 | 0 |
| 32 | Accept | 3.6433 | 0.024253 | 1.5445 | 1.5445 | -1.12 | 15 | 9115.8 | 1008.5 | 40 | 1 | 1 | 1 | 0 |
| 33 | Best | 1.5425 | 0.011052 | 1.5425 | 1.5425 | -0.00986 | 9 | 11424 | 0 | 40 | 0 | 1 | 0 | 0 |
| 34 | Accept | 6.1184 | 0.016666 | 1.5425 | 1.5425 | -4.9 | 1 | 38904 | 0 | 40 | 1 | 1 | 0 | 0 |
| 35 | Best | 1.5258 | 0.013101 | 1.5258 | 1.5258 | -0.093 | 10 | 10921 | 0 | 40 | 1 | 1 | 0 | 0 |
| 36 | Accept | 1.5376 | 0.010645 | 1.5258 | 1.5258 | -0.00127 | 9 | 11388 | 0 | 40 | 0 | 1 | 0 | 0 |
| 37 | Accept | 8.0599 | 0.010972 | 1.5258 | 1.5258 | -0.819 | 1 | 15878 | 2866.5 | 46 | 1 | 1 | 1 | 1 |
| 38 | Accept | 1.5477 | 0.011124 | 1.5258 | 1.5258 | -0.0291 | 9 | 11328 | 95.816 | 40 | 0 | 1 | 1 | 0 |
| 39 | Accept | 17.408 | 0.010852 | 1.5258 | 1.5258 | -23.9 | 16 | 99208 | 4333.8 | 27 | 1 | 1 | 1 | 1 |
| 40 | Infeas | 3.8556 | 0.011153 | 1.5258 | 1.5258 | 1 | 6 | 5726 | 0 | 83 | 1 | 1 | 0 | 1 |
|==============================================================================================================================================================================================================|
| Iter | Eval | Objective | Objective | BestSoFar | BestSoFar | Constraint1 | education_num| capital_gain | capital_loss | hours_per_we-| education_nu-| capital_gain-| capital_loss-| hours_per_we-|
| | result | | runtime | (observed) | (estim.) | violation | | | | ek | m_Indicator | _Indicator | _Indicator | ek_Indicator |
|==============================================================================================================================================================================================================|
| 41 | Accept | 4.3418 | 0.011794 | 1.5258 | 1.5258 | -1.48 | 6 | 19484 | 1164 | 22 | 1 | 1 | 1 | 1 |
| 42 | Accept | 5.0219 | 0.01884 | 1.5258 | 1.5258 | -0.0481 | 2 | 14791 | 1496.2 | 40 | 1 | 1 | 1 | 0 |
| 43 | Accept | 5.2152 | 0.016158 | 1.5258 | 1.5258 | -0.585 | 11 | 6324.1 | 628.12 | 98 | 1 | 1 | 1 | 1 |
| 44 | Accept | 1.6669 | 0.011571 | 1.5258 | 1.5258 | -0.0854 | 9 | 11020 | 0 | 49 | 0 | 1 | 0 | 1 |
| 45 | Accept | 5.8603 | 0.01388 | 1.5258 | 1.5258 | -0.899 | 15 | 9761 | 1717.2 | 4 | 1 | 1 | 1 | 1 |
| 46 | Best | 1.5123 | 0.011593 | 1.5123 | 1.5122 | -0.0685 | 10 | 10817 | 0 | 40 | 1 | 1 | 0 | 0 |
| 47 | Infeas | 1.5119 | 0.020531 | 1.5123 | 1.5122 | 1 | 10 | 7235.8 | 0 | 53 | 1 | 1 | 0 | 1 |
| 48 | Accept | 1.5272 | 0.012172 | 1.5123 | 1.5122 | -0.00394 | 9 | 11158 | 0 | 43 | 0 | 1 | 0 | 1 |
| 49 | Accept | 7.9805 | 0.01187 | 1.5123 | 1.5122 | -10.1 | 16 | 43377 | 0 | 96 | 1 | 1 | 0 | 1 |
| 50 | Infeas | 1.2275 | 0.010969 | 1.5123 | 1.5122 | 1 | 9 | 3991.6 | 445.89 | 40 | 0 | 1 | 1 | 0 |
__________________________________________________________
Optimization completed.
MaxObjectiveEvaluations of 50 reached.
Total function evaluations: 50
Total elapsed time: 25.7141 seconds
Total objective function evaluation time: 0.90318
Best observed feasible point:
education_num capital_gain capital_loss hours_per_week education_num_Indicator capital_gain_Indicator capital_loss_Indicator hours_per_week_Indicator
_____________ ____________ ____________ ______________ _______________________ ______________________ ______________________ ________________________
10 10817 0 40 1 1 0 0
Observed objective function value = 1.5123
Estimated objective function value = 1.5122
Function evaluation time = 0.011593
Observed constraint violations =[ -0.068515 ]
Best estimated feasible point (according to models):
education_num capital_gain capital_loss hours_per_week education_num_Indicator capital_gain_Indicator capital_loss_Indicator hours_per_week_Indicator
_____________ ____________ ____________ ______________ _______________________ ______________________ ______________________ ________________________
10 10817 0 40 1 1 0 0
Estimated objective function value = 1.5122
Estimated function evaluation time = 0.013576
Estimated constraint violations =[ -0.068397 ]
counterExamples=10×12 table
    age    workClass    education_num    marital_status       occupation        relationship     race     sex     capital_gain    capital_loss    hours_per_week    native_country
    ___    _________    _____________    ______________    _________________    _____________    _____    ____    ____________    ____________    ______________    ______________

    38      Private          10             Divorced       Handlers-cleaners    Not-in-family    White    Male       10817                0             40          United-States
    38      Private          10             Divorced       Handlers-cleaners    Not-in-family    White    Male       10921                0             40          United-States
    38      Private           9             Divorced       Handlers-cleaners    Not-in-family    White    Male       11158                0             43          United-States
    38      Private           9             Divorced       Handlers-cleaners    Not-in-family    White    Male       11388                0             40          United-States
    38      Private           9             Divorced       Handlers-cleaners    Not-in-family    White    Male       11424                0             40          United-States
    38      Private           9             Divorced       Handlers-cleaners    Not-in-family    White    Male       11439                0             40          United-States
    38      Private           9             Divorced       Handlers-cleaners    Not-in-family    White    Male       11328           95.816             40          United-States
    38      Private           9             Divorced       Handlers-cleaners    Not-in-family    White    Male       11544                0             40          United-States
    38      Private           9             Divorced       Handlers-cleaners    Not-in-family    White    Male       11509           75.458             40          United-States
    38      Private          11             Divorced       Handlers-cleaners    Not-in-family    White    Male       10647                0             40          United-States
The counterExamples table contains the predictor data for the counterfactual examples, listed in order of proximity to observation. If the function does not find enough feasible points during the optimization process, the number of counterfactual examples can be less than the default.
Train a tree classifier to predict whether a corporate customer has a "good" or "poor" credit rating. For a customer who is predicted to have a poor rating, find counterfactual examples by using the counterfactuals function. That is, determine a minimal set of changes to the customer profile that leads to a predicted credit rating of "good." Display diagnostics for the counterfactual examples.
Read the sample file CreditRating_Historical.dat into a table. The predictor data consists of financial ratios and industry sector information for a list of corporate customers. The response variable consists of credit ratings assigned by a rating agency. Preview the first few rows of the data set.
creditrating = readtable("CreditRating_Historical.dat");
head(creditrating)
ID WC_TA RE_TA EBIT_TA MVE_BVTD S_TA Industry Rating
_____ ______ ______ _______ ________ _____ ________ _______
62394 0.013 0.104 0.036 0.447 0.142 3 {'BB' }
48608 0.232 0.335 0.062 1.969 0.281 8 {'A' }
42444 0.311 0.367 0.074 1.935 0.366 1 {'A' }
48631 0.194 0.263 0.062 1.017 0.228 4 {'BBB'}
43768 0.121 0.413 0.057 3.647 0.466 12 {'AAA'}
39255 -0.117 -0.799 0.01 0.179 0.082 4 {'CCC'}
62236 0.087 0.158 0.049 0.816 0.324 2 {'BBB'}
39354 0.005 0.181 0.034 2.597 0.388 7 {'AA' }
In the Rating response variable, combine the AAA, AA, A, and BBB ratings into a category of "good" ratings, and the BB, B, and CCC ratings into a category of "poor" ratings. Also, convert the Industry variable to a categorical variable.
Rating = categorical(creditrating.Rating);
Rating = mergecats(Rating,["AAA","AA","A","BBB"],"good");
Rating = mergecats(Rating,["BB","B","CCC"],"poor");
creditrating.Rating = Rating;
creditrating.Industry = categorical(creditrating.Industry);
Train a tree classifier using the creditrating data. Specify the Rating column of creditrating as the response, and the other columns, excluding ID, as predictors.
predictors = ["WC_TA","RE_TA","EBIT_TA","MVE_BVTD","S_TA", ...
    "Industry"];
rng(0,"twister") % For reproducibility
Mdl = fitctree(creditrating,"Rating",PredictorNames=predictors)
Mdl =
  ClassificationTree
           PredictorNames: {'WC_TA'  'RE_TA'  'EBIT_TA'  'MVE_BVTD'  'S_TA'  'Industry'}
             ResponseName: 'Rating'
    CategoricalPredictors: 6
               ClassNames: [good    poor]
           ScoreTransform: 'none'
          NumObservations: 3932


  Properties, Methods
Mdl is a ClassificationTree object. You can use the model object along with its predict function to predict whether a customer has a good credit rating.
Display the sixth observation in creditrating. Determine the predicted credit rating for the corporate customer whose information is in observation.
observation = creditrating(6,:)
observation=1×8 table
     ID      WC_TA     RE_TA     EBIT_TA    MVE_BVTD    S_TA     Industry    Rating
    _____    ______    ______    _______    ________    _____    ________    ______

    39255    -0.117    -0.799     0.01       0.179      0.082       4         poor
label = predict(Mdl,observation)
label = categorical
     poor
The corporate customer has a predicted credit rating of poor.
Generate five counterfactual examples for the observation (corporate customer with ID 39255). Additionally return diagnostics for the counterfactual examples. By default, the counterfactuals function uses a Bayesian optimization routine with 50 iterations. The optimization process can take some time.
rng(0,"twister")
[counterExamples,metrics] = counterfactuals(Mdl,observation, ...
NumCounterfactualExamples=5);
|==========================================================================================================================================================================================================================================================================|
| Iter | Eval | Objective | Objective | BestSoFar | BestSoFar | Constraint1 | WC_TA | RE_TA | EBIT_TA | MVE_BVTD | S_TA | Industry | WC_TA_Indica-| RE_TA_Indica-| EBIT_TA_Indi-| MVE_BVTD_Ind-| S_TA_Indicat-| Industry_Ind-|
| | result | | runtime | (observed) | (estim.) | violation | | | | | | | tor | tor | cator | icator | or | icator |
|==========================================================================================================================================================================================================================================================================|
| 1 | Infeas | 0.26817 | 0.50708 | NaN | 0.26817 | 1 | -0.117 | -0.17048 | 0.16531 | 0.179 | 0.29959 | 4 | 0 | 1 | 1 | 0 | 1 | 0 |
| 2 | Infeas | 0.48947 | 0.26762 | NaN | 0.26817 | 1 | -0.117 | -0.799 | 0.20204 | 0.179 | 6.4577 | 3 | 0 | 0 | 1 | 0 | 1 | 1 |
| 3 | Infeas | 0.3406 | 0.066527 | NaN | 0.26817 | 1 | -1.5205 | 1.0139 | -0.52017 | 0.179 | 0.082 | 12 | 1 | 1 | 1 | 0 | 0 | 1 |
| 4 | Best | 0.4911 | 0.028147 | 0.4911 | 0.4911 | -0.5 | -0.117 | 1.6522 | 0.01 | 73.705 | 0.082 | 3 | 0 | 1 | 0 | 1 | 0 | 1 |
| 5 | Best | 0.32483 | 0.05205 | 0.32483 | 0.32483 | -0.5 | -0.117 | 1.0724 | 0.01 | 72.905 | 0.082 | 4 | 0 | 1 | 0 | 1 | 0 | 0 |
| 6 | Accept | 0.32517 | 0.013555 | 0.32483 | 0.32483 | -0.5 | -0.117 | 1.3803 | 0.01 | 69.491 | 0.082 | 4 | 0 | 1 | 0 | 1 | 0 | 1 |
| 7 | Infeas | 0.1716 | 0.013136 | 0.32483 | 0.32483 | 1 | -0.117 | -3.0319 | -0.59091 | 0.179 | 1.2919 | 4 | 0 | 1 | 1 | 0 | 1 | 0 |
| 8 | Accept | 0.33178 | 0.014379 | 0.32483 | 0.32483 | -0.367 | -0.117 | -2.9936 | -0.58945 | 82.953 | 2.2296 | 4 | 0 | 1 | 1 | 1 | 1 | 0 |
| 9 | Best | 0.32309 | 0.01392 | 0.32309 | 0.32309 | -0.367 | -0.117 | -2.6046 | 0.01 | 71.686 | 1.0103 | 4 | 0 | 1 | 0 | 1 | 1 | 0 |
| 10 | Infeas | 0.010967 | 0.0124 | 0.32309 | 0.32309 | 1 | -0.117 | -2.9336 | 0.01 | 0.29214 | 0.082 | 4 | 0 | 1 | 0 | 1 | 0 | 0 |
| 11 | Best | 0.16316 | 0.012652 | 0.16316 | 0.16316 | -0.367 | -0.117 | -3.246 | 0.01 | 43.108 | 0.082 | 4 | 0 | 1 | 0 | 1 | 0 | 0 |
| 12 | Infeas | 0.0080855 | 0.013371 | 0.16316 | 0.16316 | 1 | -0.117 | -0.799 | 0.01 | 0.038794 | 0.082 | 4 | 0 | 0 | 0 | 1 | 0 | 1 |
| 13 | Accept | 0.2112 | 0.011575 | 0.16316 | 0.16316 | -0.5 | -0.13893 | -0.799 | -0.43091 | 0.66632 | 2.8912 | 4 | 1 | 0 | 1 | 1 | 1 | 0 |
| 14 | Accept | 0.23857 | 0.011147 | 0.16316 | 0.16316 | -0.5 | -0.117 | 0.1938 | -0.52596 | 34.596 | 0.082 | 4 | 0 | 1 | 1 | 1 | 0 | 0 |
| 15 | Infeas | 0.2415 | 0.011438 | 0.16316 | 0.16316 | 1 | 0.13161 | -0.799 | 0.01 | 0.179 | 0.76163 | 4 | 1 | 0 | 0 | 0 | 1 | 1 |
| 16 | Accept | 0.60903 | 0.011517 | 0.16316 | 0.16316 | -0.367 | 0.42198 | -1.7231 | 0.20164 | 2.9758 | 2.1236 | 4 | 1 | 1 | 1 | 1 | 1 | 0 |
| 17 | Best | 0.16287 | 0.011607 | 0.16287 | 0.16287 | -0.367 | -0.117 | -2.6267 | 0.01 | 23.678 | 0.082 | 4 | 0 | 1 | 0 | 1 | 0 | 0 |
| 18 | Best | 0.10977 | 0.011277 | 0.10977 | 0.10977 | -0.367 | -0.15617 | -0.799 | 0.01 | 1.8443 | 0.082 | 4 | 1 | 0 | 0 | 1 | 0 | 0 |
| 19 | Best | 0.077053 | 0.01167 | 0.077053 | 0.077053 | -0.167 | -1.6761 | -0.799 | -0.25553 | 0.9777 | 0.082 | 4 | 1 | 0 | 1 | 1 | 0 | 1 |
| 20 | Infeas | 0.1371 | 0.013347 | 0.077053 | 0.077053 | 1 | -1.0156 | 0.013992 | -0.57955 | 1.684 | 0.082 | 4 | 1 | 1 | 1 | 1 | 0 | 0 |
|==========================================================================================================================================================================================================================================================================|
| Iter | Eval | Objective | Objective | BestSoFar | BestSoFar | Constraint1 | WC_TA | RE_TA | EBIT_TA | MVE_BVTD | S_TA | Industry | WC_TA_Indica-| RE_TA_Indica-| EBIT_TA_Indi-| MVE_BVTD_Ind-| S_TA_Indicat-| Industry_Ind-|
| | result | | runtime | (observed) | (estim.) | violation | | | | | | | tor | tor | cator | icator | or | icator |
|==========================================================================================================================================================================================================================================================================|
| 21 | Infeas | 0.16022 | 0.011291 | 0.077053 | 0.077053 | 1 | 0.26254 | -0.80631 | -0.26419 | 0.51331 | 0.082 | 4 | 1 | 1 | 1 | 1 | 0 | 0 |
| 22 | Infeas | 0.16041 | 0.015516 | 0.077053 | 0.077053 | 1 | -2.2258 | -0.799 | 0.01 | 8.5207 | 0.082 | 4 | 1 | 0 | 0 | 1 | 0 | 0 |
| 23 | Accept | 0.077562 | 0.014002 | 0.077053 | 0.077054 | -0.167 | -1.68 | -0.799 | -0.16012 | 0.98831 | 0.082 | 4 | 1 | 0 | 1 | 1 | 0 | 0 |
| 24 | Infeas | 0.15958 | 0.013708 | 0.077053 | 0.077053 | 1 | -1.631 | -0.799 | 0.023051 | 4.5989 | 0.082 | 4 | 1 | 0 | 1 | 1 | 0 | 0 |
| 25 | Accept | 0.11964 | 0.011669 | 0.077053 | 0.077053 | -0.367 | -0.10478 | -0.799 | 0.01 | 2.2284 | 0.082 | 4 | 1 | 0 | 0 | 1 | 0 | 0 |
| 26 | Infeas | 0.013425 | 0.011841 | 0.077053 | 0.077053 | 1 | -1.2076 | -2.6688 | 0.01 | 0.050326 | 0.082 | 4 | 1 | 1 | 0 | 1 | 0 | 0 |
| 27 | Infeas | 0.053852 | 0.010968 | 0.077053 | 0.077053 | 1 | -1.2803 | -0.799 | -0.29726 | 0.69133 | 0.082 | 4 | 1 | 0 | 1 | 1 | 0 | 0 |
| 28 | Accept | 0.22825 | 0.011956 | 0.077053 | 0.077053 | -0.367 | 0.094888 | -3.1318 | 0.01 | 7.7412 | 0.082 | 4 | 1 | 1 | 0 | 1 | 0 | 0 |
| 29 | Infeas | 0.20276 | 0.015039 | 0.077053 | 0.077053 | 1 | -0.117 | -0.799 | 0.12028 | 0.69785 | 0.082 | 4 | 0 | 0 | 1 | 1 | 0 | 0 |
| 30 | Infeas | 0.092288 | 0.012645 | 0.077053 | 0.077053 | 1 | -0.5544 | -2.1103 | 0.01 | 1.3011 | 0.082 | 4 | 1 | 1 | 0 | 1 | 0 | 0 |
| 31 | Infeas | 0.048894 | 0.010991 | 0.077053 | 0.077053 | 1 | -0.52267 | -0.799 | 0.01 | 0.71116 | 0.082 | 4 | 1 | 0 | 0 | 1 | 0 | 0 |
| 32 | Infeas | 0.066904 | 0.011913 | 0.077053 | 0.077053 | 1 | -1.5836 | -0.799 | -0.22985 | 0.83931 | 0.082 | 4 | 1 | 0 | 1 | 1 | 0 | 0 |
| 33 | Infeas | 0.0052675 | 0.012152 | 0.077053 | 0.077053 | 1 | -1.3814 | -0.799 | 0.01 | 0.179 | 0.082 | 4 | 1 | 0 | 0 | 0 | 0 | 0 |
| 34 | Infeas | 0.0037843 | 0.010922 | 0.077053 | 0.077053 | 1 | -0.117 | -3.2625 | 0.01 | 0.179 | 0.082 | 4 | 0 | 1 | 0 | 0 | 0 | 0 |
| 35 | Infeas | 0.085719 | 0.011322 | 0.077053 | 0.077053 | 1 | 0.13048 | -0.799 | 0.01 | 0.179 | 0.082 | 4 | 1 | 0 | 0 | 0 | 0 | 0 |
| 36 | Infeas | 0.0050132 | 0.012732 | 0.077053 | 0.077053 | 1 | -0.72619 | -0.799 | 0.01 | 0.179 | 0.082 | 4 | 1 | 0 | 0 | 0 | 0 | 0 |
| 37 | Infeas | 0.0033817 | 0.010955 | 0.077053 | 0.077053 | 1 | -0.1869 | -0.799 | 0.01 | 0.179 | 0.082 | 4 | 1 | 0 | 0 | 0 | 0 | 0 |
| 38 | Accept | 0.12117 | 0.010979 | 0.077053 | 0.077053 | -0.367 | -0.24026 | -0.799 | 0.01 | 2.2306 | 0.082 | 4 | 1 | 0 | 0 | 1 | 0 | 0 |
| 39 | Infeas | 0.081291 | 0.011551 | 0.077053 | 0.077053 | 1 | -0.14034 | -0.799 | 0.01 | 1.172 | 0.082 | 4 | 1 | 0 | 0 | 1 | 0 | 0 |
| 40 | Infeas | 0.0061786 | 0.011493 | 0.077053 | 0.077053 | 1 | -0.31018 | -3.0656 | 0.01 | 0.179 | 0.082 | 4 | 1 | 1 | 0 | 0 | 0 | 0 |
|==========================================================================================================================================================================================================================================================================|
| Iter | Eval | Objective | Objective | BestSoFar | BestSoFar | Constraint1 | WC_TA | RE_TA | EBIT_TA | MVE_BVTD | S_TA | Industry | WC_TA_Indica-| RE_TA_Indica-| EBIT_TA_Indi-| MVE_BVTD_Ind-| S_TA_Indicat-| Industry_Ind-|
| | result | | runtime | (observed) | (estim.) | violation | | | | | | | tor | tor | cator | icator | or | icator |
|==========================================================================================================================================================================================================================================================================|
| 41 | Infeas | 0.16946 | 0.013665 | 0.077053 | 0.077053 | 1 | -1.115 | 1.4854 | 0.01 | 0.179 | 0.082 | 4 | 1 | 1 | 0 | 0 | 0 | 0 |
| 42 | Infeas | 0.14333 | 0.012446 | 0.077053 | 0.077053 | 1 | -1.682 | -1.0086 | -0.19245 | 0.179 | 0.42391 | 4 | 1 | 1 | 1 | 0 | 1 | 0 |
| 43 | Infeas | 0.0038267 | 0.013989 | 0.077053 | 0.077053 | 1 | -0.24297 | -0.799 | 0.01 | 0.179 | 0.082 | 4 | 1 | 0 | 0 | 0 | 0 | 0 |
| 44 | Infeas | 0.0052675 | 0.012501 | 0.077053 | 0.077053 | 1 | -1.0416 | -0.799 | 0.01 | 0.179 | 0.082 | 4 | 1 | 0 | 0 | 0 | 0 | 0 |
| 45 | Infeas | 0.0029792 | 0.011013 | 0.077053 | 0.077053 | 1 | -0.11117 | -1.6065 | 0.01 | 0.179 | 0.082 | 4 | 1 | 1 | 0 | 0 | 0 | 0 |
| 46 | Accept | 0.3093 | 0.011682 | 0.077053 | 0.077053 | -0.5 | -0.117 | 0.55139 | 0.01 | 26.936 | 0.082 | 4 | 0 | 1 | 0 | 1 | 0 | 0 |
| 47 | Accept | 0.16202 | 0.011139 | 0.077053 | 0.077053 | -0.367 | -0.117 | -1.9857 | 0.01 | 19.911 | 0.082 | 4 | 0 | 1 | 0 | 1 | 0 | 0 |
| 48 | Infeas | 0.0053734 | 0.012275 | 0.077053 | 0.077053 | 1 | -0.18197 | -2.4817 | 0.01 | 0.179 | 0.082 | 4 | 1 | 1 | 0 | 0 | 0 | 0 |
| 49 | Infeas | 0.0064329 | 0.012885 | 0.077053 | 0.077053 | 1 | -1.2316 | -1.6373 | 0.01 | 0.179 | 0.082 | 4 | 1 | 1 | 0 | 0 | 0 | 0 |
| 50 | Infeas | 0.0036996 | 0.012831 | 0.077053 | 0.077053 | 1 | -0.16775 | -0.97682 | 0.01 | 0.179 | 0.082 | 4 | 1 | 1 | 0 | 0 | 0 | 0 |
__________________________________________________________
Optimization completed.
MaxObjectiveEvaluations of 50 reached.
Total function evaluations: 50
Total elapsed time: 35.5041 seconds
Total objective function evaluation time: 1.4765
Best observed feasible point:
WC_TA RE_TA EBIT_TA MVE_BVTD S_TA Industry WC_TA_Indicator RE_TA_Indicator EBIT_TA_Indicator MVE_BVTD_Indicator S_TA_Indicator Industry_Indicator
_______ ______ ________ ________ _____ ________ _______________ _______________ _________________ __________________ ______________ __________________
-1.6761 -0.799 -0.25553 0.9777 0.082 4 1 0 1 1 0 1
Observed objective function value = 0.077053
Estimated objective function value = 0.077053
Function evaluation time = 0.01167
Observed constraint violations =[ -0.166667 ]
Best estimated feasible point (according to models):
WC_TA RE_TA EBIT_TA MVE_BVTD S_TA Industry WC_TA_Indicator RE_TA_Indicator EBIT_TA_Indicator MVE_BVTD_Indicator S_TA_Indicator Industry_Indicator
_______ ______ ________ ________ _____ ________ _______________ _______________ _________________ __________________ ______________ __________________
-1.6761 -0.799 -0.25553 0.9777 0.082 4 1 0 1 1 0 1
Estimated objective function value = 0.077053
Estimated function evaluation time = 0.011687
Estimated constraint violations =[ -0.166667 ]
The counterExamples table contains the predictor data for the counterfactual examples, listed in order of proximity to observation. The metrics table contains additional information about the counterfactual examples.
Combine the metrics and counterExamples tables.
Tbl = [metrics,counterExamples]
Tbl=5×10 table
    Distance    NumModifiedPredictors    LearnerScore    AnomalyScore     WC_TA      RE_TA     EBIT_TA     MVE_BVTD    S_TA     Industry
    ________    _____________________    ____________    ____________    ________    ______    ________    ________    _____    ________

    0.077053              3                0.66667           NaN          -1.6761    -0.799    -0.25553     0.9777     0.082       4
    0.077562              3                0.66667           NaN            -1.68    -0.799    -0.16012    0.98831     0.082       4
     0.10977              2                0.86667           NaN         -0.15617    -0.799        0.01     1.8443     0.082       4
     0.11964              2                0.86667           NaN         -0.10478    -0.799        0.01     2.2284     0.082       4
     0.12117              2                0.86667           NaN         -0.24026    -0.799        0.01     2.2306     0.082       4
The first counterfactual example is the smallest distance away from the original observation. However, this counterfactual example has more modified predictors (3) and a lower learner score (0.6667) than the third, fourth, and fifth counterfactual examples. The lower learner score indicates that the classifier is less confident in the prediction of the first counterfactual example than in the prediction of the third, fourth, and fifth counterfactual examples.
Verify the model predictions for the counterfactual examples by using the predict function of Mdl.
[labels,scores] = predict(Mdl,counterExamples);
predictions = array2table(scores,VariableNames=string(Mdl.ClassNames))
predictions=5×2 table
     good       poor
    _______    _______

    0.66667    0.33333
    0.66667    0.33333
    0.86667    0.13333
    0.86667    0.13333
    0.86667    0.13333
Input Arguments
Name-Value Arguments
Output Arguments
Limitations
Ordered categorical predictors are not supported.
Algorithms
The counterfactuals function uses Bayesian optimization to find and
return counterfactual examples. The function selects counterfactual candidates
z that are a minimal distance away from the original observation
x (observation), have a different predicted label
from x, have few predictor values that differ from x,
and (optionally) are not anomalies. That is, the function finds z such
that is optimized with the following constraints:
, where is the predicted class label for z and is the predicted class label for x.
, where ||·||0 is the L0 norm and p is the maximum number of predictors that can be changed (
MaxNumModifiablePredictors)., where a(z) is the anomaly score for z and amax is the anomaly constraint threshold (
MaxAnomalyScore).
The distance depends on the mix of modifiable predictors
(ModifiablePredictors). The distance is the fast standardized
Euclidean distance if all the modifiable predictors are continuous (numeric), the Hamming
distance if all the modifiable predictors are categorical, and the modified Goodall distance
if the modifiable predictors are a mix of continuous and categorical variables. For more
information, see Distance Metrics.
The following image illustrates the position of a counterfactual example in relation to the original observation.
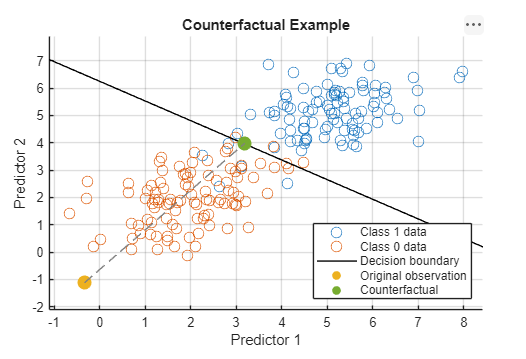
The original observation belongs to class 0, and observations below the decision boundary are predicted as belonging to class 0. The software tries to find the closest observation beyond the decision boundary that meets the required constraints.
Extended Capabilities
Version History
Introduced in R2026a