Shapley Output Functions
A Shapley output function is a function that is called at the end of every iteration of
the shapley or
fit function. The
output function can stop Shapley computations, create plots, save information to your
workspace, or perform calculations using query point information.
To use the OutputFcn name-value argument in the call to
shapley or fit, write a custom output function
with this signature:
stop = outputfcn(x,results,state)
The shapley or fit function passes the variables
x, results, and state to your
output function. Your output function returns stop, which you set to
true to stop the iterations, or false to allow the
iterations to continue.
xcontains the Shapley values for the query point at the current iteration.resultsis a structure with these fields:Iteration— Current iteration numberQueryPointIndex— Index of the query point evaluated at the current iterationTimePerQuery— Time spent computing the Shapley values for the query point at the current iterationMethod— Method used to compute the Shapley values for the query point at the current iteration
statehas these possible values:"init"—shapleyorfitis about to start iterating."iter"—shapleyorfitjust finished an iteration."done"—shapleyorfitjust finished its final iteration.
Stop Shapley Value Computations Early
Train a classification model. Compute the Shapley values for multiple query points. Specify to stop the Shapley computations if they take too much time, and plot the partial results.
Load the CreditRating_Historical data set. The data set contains customer IDs and their financial ratios, industry labels, and credit ratings.
tbl = readtable("CreditRating_Historical.dat");Display the first three rows of the table.
head(tbl,3)
     ID      WC_TA    RE_TA    EBIT_TA    MVE_BVTD    S_TA     Industry    Rating
    _____    _____    _____    _______    ________    _____    ________    ______

    62394    0.013    0.104     0.036      0.447      0.142       3        {'BB'}
    48608    0.232    0.335     0.062      1.969      0.281       8        {'A' }
    42444    0.311    0.367     0.074      1.935      0.366       1        {'A' }
Train a blackbox model of credit ratings by using the fitcecoc function. Use the variables from the second through seventh columns in tbl as the predictor variables. A recommended practice is to specify the class names to set the order of the classes.
blackbox = fitcecoc(tbl,"Rating", ...
    PredictorNames=tbl.Properties.VariableNames(2:7), ...
    CategoricalPredictors="Industry", ...
    ClassNames={'AAA','AA','A','BBB','BB','B','CCC'});
Create a shapley object that explains the predictions for multiple query points. For faster computation, subsample 10% of the observations from tbl with stratification and use the samples to compute the Shapley values. Set NumObservationsToSample to "all" to prevent shapley from further subsampling the observations. Specify the sampled observations as the query points.
Use the output function earlystop (shown at the end of this example) to stop the Shapley value computations early if the cumulative computation time exceeds 60 seconds. If shapley stops early, the output function creates two new variables in the workspace: totalTime and numQueryPoints.
rng("default") % For reproducibility
c = cvpartition(tbl.Rating,"Holdout",0.10);
sampleTbl = tbl(test(c),:);
explainer = shapley(blackbox,sampleTbl, ...
    queryPoints=sampleTbl,NumObservationsToSample="all", ...
    OutputFcn=@earlystop);
Warning: Iterations terminated prematurely by user.
Display the total Shapley value computation time.
totalTime
totalTime =
60.2748
Note that the time only slightly exceeds 60 seconds.
Compare the total number of observations in sampleTbl to the number of query points whose Shapley values were computed by shapley.
numObservations = size(sampleTbl,1)
numObservations =
393
numQueryPoints
numQueryPoints =
97
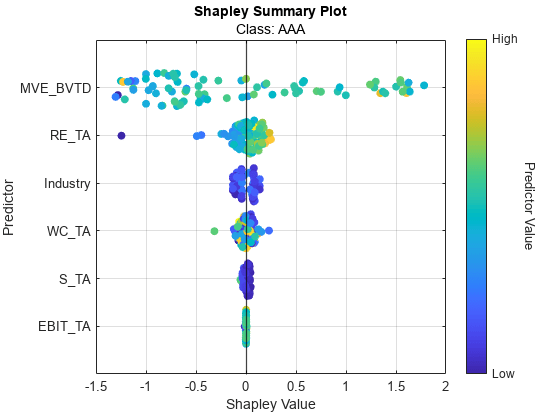
Display a swarm chart of the partial results.
swarmchart(explainer)
Output Function
The output function earlystop uses the query point computation times in results (results.TimePerQuery) to determine whether to stop Shapley computations early. If the cumulative computation time exceeds 60 seconds, the function stops early. This code creates the earlystop output function.
function stop = earlystop(~,results,state)
persistent totalTime
stop = false;
switch state
    case "init"
        totalTime = 0;
    case "iter"
        totalTime = totalTime + results.TimePerQuery;
        if totalTime > 60
            assignin("base","totalTime",totalTime)
            assignin("base","numQueryPoints",results.Iteration)
            stop = true;
        end
    otherwise
end
end
Find Method Used for Individual Shapley Value Computations
Train an ensemble model that uses tree weak learners with surrogate splits. Compute the Shapley values for multiple query points using predictor data that contains missing values. In this case, the Shapley value computation algorithm might not be the same for all query points. Use an output function to determine the method used to compute the Shapley values for each query point.
Load the fisheriris data set, which contains measurements for 150 irises, and create a table. SepalLength, SepalWidth, PetalLength, and PetalWidth are the predictor variables, and Species is the response variable.
fisheriris = readtable("fisheriris.csv");Partition the data into two sets. Use 50% of the observations for training and 50% of the observations for computing Shapley values.
rng("default")
c = cvpartition(fisheriris.Species,"Holdout",0.5);
trainTbl = fisheriris(training(c),:);
queryTbl = fisheriris(test(c),:);
For this example, add a missing value to the second observation in queryTbl.
queryTbl{2,4} = NaN;
queryTbl(2,:)ans=1×5 table
SepalLength SepalWidth PetalLength PetalWidth Species
___________ __________ ___________ __________ __________
4.9 3 1.4 NaN {'setosa'}
Train a classification ensemble by using the fitcensemble function. Specify to use tree stumps with surrogate splits as the weak learners.
tree = templateTree(Surrogate="on",MaxNumSplits=1);
mdl = fitcensemble(trainTbl,"Species",Learners=tree);
Create a shapley object that explains the predictions for the query points in queryTbl. Use the queryTbl predictor data to compute the Shapley values.
Use the output function methodinfo (shown at the end of this example) to find the Shapley value computation algorithm used for each query point. The function also returns the index of the query point evaluated at each iteration.
explainer = shapley(mdl,queryTbl,QueryPoints=queryTbl, ...
    OutputFcn=@methodinfo)
Warning: Computations might be slow when the tree-based model uses surrogate splits for prediction. In this case, the software uses a mix of 'interventional-kernel' and 'interventional-tree'.
explainer =
shapley explainer with the following mean absolute Shapley values:

      Predictor        setosa      versicolor    virginica
    _____________    __________    __________    __________

    "SepalLength"      0.056765       0.23593       0.17916
    "SepalWidth"     4.8278e-16    3.7358e-16    2.9962e-16
    "PetalLength"        4.4249        1.6484        3.1843
    "PetalWidth"         0.1696       0.52159       0.69119


  Properties, Methods
The warning message indicates that shapley might use a mix of the Tree SHAP algorithm with an interventional value function and the Kernel SHAP algorithm with an interventional value function. The Method property of the explainer object reflects this information with the value "interventional-mix".
explainer.Method
ans =
"interventional-mix"
Create a table containing the method information for each query point.
methodInfoTbl = table(queryPointIndex',methodType', ...
    VariableNames=["QueryPointIndex","Method"])
methodInfoTbl=75×2 table
    QueryPointIndex            Method
    _______________    _______________________

           1           "interventional-kernel"
           2           "interventional-kernel"
           3           "interventional-kernel"
           4           "interventional-kernel"
           5           "interventional-kernel"
           6           "interventional-kernel"
           7           "interventional-kernel"
           8           "interventional-kernel"
           9           "interventional-kernel"
          10           "interventional-kernel"
          11           "interventional-kernel"
          12           "interventional-kernel"
          13           "interventional-kernel"
          14           "interventional-kernel"
          15           "interventional-kernel"
          16           "interventional-kernel"
      ⋮
unique(methodInfoTbl.Method)
ans =
"interventional-kernel"
In this example, every query point uses the "interventional-kernel" method.
As a convenience, the output function methodinfo additionally returns the Shapley values for each query point. This information is also available in the Shapley property of explainer.
Find the Shapley values for the second query point. Recall from the table methodInfoTbl that the function evaluated the second query point during the second iteration.
rowNames = explainer.Shapley{:,1};
varNames = ...
    explainer.Shapley.Properties.VariableNames(2:end);
queryPointInfo = array2table(shapleyValues(:,:,2), ...
RowNames=rowNames,VariableNames=varNames)queryPointInfo=4×3 table
setosa versicolor virginica
___________ ___________ __________
SepalLength 0.037345 -0.15521 0.11787
SepalWidth -9.7992e-16 -4.8954e-16 6.7612e-16
PetalLength 6.6859 -2.0038 -4.6821
PetalWidth 0.067022 0.20267 -0.2697
For an example that shows how to find the Shapley values for a specific query point without using an output function, see Investigate One Query Point After Fitting Multiple Query Points.
Output Function
The output function methodinfo records the query point index (results.QueryPointIndex), Shapley values (x), and method (results.Method) at each iteration. The function returns the information to the MATLAB® workspace as the variables queryPointIndex, shapleyValues, and methodType, respectively. This code creates the methodinfo output function.
function stop = methodinfo(x,results,state)
persistent queryPointIndex
persistent shapleyValues
persistent methodType
stop = false;
switch state
    case "init"
        queryPointIndex = [];
        shapleyValues = zeros(4,3,1);
            % Initialize shapleyValues based on predictors and classes
        methodType = "";
    case "iter"
        queryPointIndex(results.Iteration) = results.QueryPointIndex;
        shapleyValues(:,:,results.Iteration) = x;
        methodType(results.Iteration) = results.Method;
    case "done"
        assignin("base","queryPointIndex",queryPointIndex)
        assignin("base","shapleyValues",shapleyValues)
        assignin("base","methodType",methodType)
    otherwise
end
end
See Also
shapley | fit | plot | boxchart | swarmchart