fit
Description
computes the Shapley values for the specified query points
(newExplainer
= fit(explainer
,queryPoints
)queryPoints
) and stores the computed Shapley values in the ShapleyValues
property of newExplainer
. The shapley
object
explainer
contains a machine learning model and the options for
computing Shapley values.
fit
uses the Shapley value computation options that you specify
when you create explainer
. You can change the options using the
name-value arguments of the fit
function. The function returns a
shapley
object newExplainer
that contains the newly
computed Shapley values.
specifies additional options using one or more name-value arguments. For example, specify
newExplainer
= fit(explainer
,queryPoints
,Name=Value
)UseParallel=true
to compute Shapley values in parallel.
Examples
Create shapley
Object and Compute Shapley Values Using fit
Train a regression model and create a shapley
object. When you create a shapley
object, if you do not specify query points, then the software does not compute Shapley values. Use the object function fit
to compute the Shapley values for a specified query point. Then create a bar graph of the Shapley values by using the object function plot
.
Load the carbig
data set, which contains measurements of cars made in the 1970s and early 1980s.
load carbig
Create a table containing the predictor variables Acceleration
, Cylinders
, and so on, as well as the response variable MPG
.
tbl = table(Acceleration,Cylinders,Displacement, ...
Horsepower,Model_Year,Weight,MPG);
Removing missing values in a training set can help reduce memory consumption and speed up training for the fitrkernel
function. Remove missing values in tbl
.
tbl = rmmissing(tbl);
Train a blackbox model of MPG
by using the fitrkernel
function. Specify the Cylinders
and Model_Year
variables as categorical predictors. Standardize the remaining predictors.
rng("default") % For reproducibility mdl = fitrkernel(tbl,"MPG",CategoricalPredictors=[2 5], ... Standardize=true);
Create a shapley
object. Specify the data set tbl
, because mdl
does not contain training data.
explainer = shapley(mdl,tbl)
explainer = BlackboxModel: [1x1 RegressionKernel] QueryPoints: [] BlackboxFitted: [] ShapleyValues: [] X: [392x7 table] CategoricalPredictors: [2 5] Method: "interventional-kernel" Intercept: 22.7326 NumSubsets: 64
explainer
stores the training data tbl
in the X
property.
Compute the Shapley values of all predictor variables for the first observation in tbl
.
queryPoint = tbl(1,:)
queryPoint=1×7 table
Acceleration Cylinders Displacement Horsepower Model_Year Weight MPG
____________ _________ ____________ __________ __________ ______ ___
12 8 307 130 70 3504 18
explainer = fit(explainer,queryPoint);
For a regression model, shapley
computes Shapley values using the predicted response, and stores them in the ShapleyValues
property. Display the values in the ShapleyValues
property.
explainer.ShapleyValues
ans=6×2 table
Predictor ShapleyValue
______________ ____________
"Acceleration" -0.23731
"Cylinders" -0.87423
"Displacement" -1.0224
"Horsepower" -0.56975
"Model_Year" -0.055414
"Weight" -0.86088
Plot the Shapley values for the query point by using the plot
function.
plot(explainer)
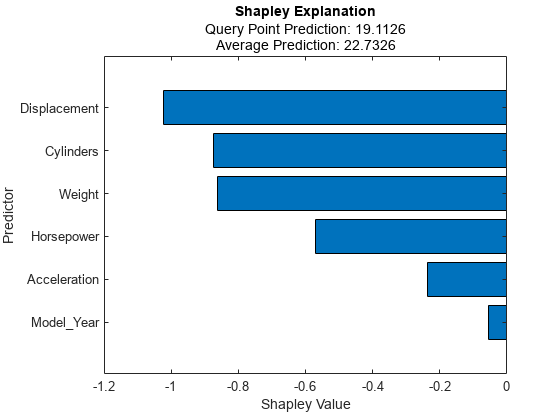
The horizontal bar graph shows the Shapley values for all variables, sorted by their absolute values. Each Shapley value explains the deviation of the prediction for the query point from the average, due to the corresponding variable.
Compute Shapley Values for Two Query Points
Train a classification model and create a shapley
object. Then compute the Shapley values for two query points.
Load the CreditRating_Historical
data set. The data set contains customer IDs and their financial ratios, industry labels, and credit ratings.
tbl = readtable("CreditRating_Historical.dat");
Train a blackbox model of credit ratings by using the fitcecoc
function. Use the variables from the second through seventh columns in tbl
as the predictor variables.
blackbox = fitcecoc(tbl,"Rating", ... PredictorNames=tbl.Properties.VariableNames(2:7), ... CategoricalPredictors="Industry");
Create a shapley
object with the blackbox
model. For faster computation, subsample 25% of the observations from tbl
with stratification and use the samples to compute the Shapley values. Specify to use the extension to the Kernel SHAP algorithm.
rng("default") % For reproducibility c = cvpartition(tbl.Rating,"Holdout",0.25); sampleTbl = tbl(test(c),:); explainer = shapley(blackbox,sampleTbl,Method="conditional");
Find two query points whose true rating values are AAA
and B
, respectively.
queryPoints(1,:) = sampleTbl(find(strcmp(sampleTbl.Rating,"AAA"),1),:); queryPoints(2,:) = sampleTbl(find(strcmp(sampleTbl.Rating,"B"),1),:)
queryPoints=2×8 table
ID WC_TA RE_TA EBIT_TA MVE_BVTD S_TA Industry Rating
_____ ______ ______ _______ ________ _____ ________ _______
58258 0.511 0.869 0.106 8.538 0.732 2 {'AAA'}
82367 -0.078 -0.042 0.011 0.262 0.167 7 {'B' }
Compute and plot the Shapley values for the first query point.
explainer1 = fit(explainer,queryPoints(1,:)); plot(explainer1)
Compute and plot the Shapley values for the second query point.
explainer2 = fit(explainer,queryPoints(2,:)); plot(explainer2)
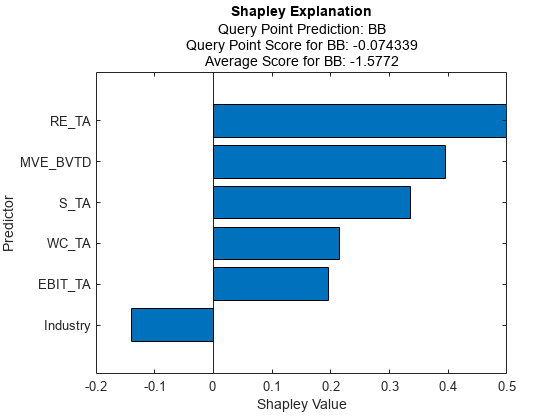
The true rating for the second query point is B
, but the predicted rating is BB
. The plot shows the Shapley values for the predicted rating.
explainer1
and explainer2
include the Shapley values for the first query point and second query point, respectively.
Shapley Value Swarm Charts for Regression Model
Train a regression model and create a shapley
object. Use the object function fit
to compute the Shapley values for the specified query points. Then plot the Shapley values for multiple query points by using the swarmchart
object function.
Load the carbig
data set, which contains measurements of cars made in the 1970s and early 1980s.
load carbig
Create a table containing the predictor variables Acceleration
, Cylinders
, and so on, as well as the response variable MPG
.
tbl = table(Acceleration,Cylinders,Displacement, ...
Horsepower,Model_Year,Weight,MPG);
Removing missing values in a training set helps to reduce memory consumption and speed up training for the fitrkernel
function. Remove missing values in tbl
.
tbl = rmmissing(tbl);
Train a blackbox model of MPG
by using the fitrkernel
function. Specify the Cylinders
and Model_Year
variables as categorical predictors. Standardize the remaining predictors.
rng("default") % For reproducibility mdl = fitrkernel(tbl,"MPG",CategoricalPredictors=[2 5], ... Standardize=true);
Create a shapley
object. Because mdl
does not contain training data, specify the data set tbl
.
explainer = shapley(mdl,tbl)
explainer = BlackboxModel: [1×1 RegressionKernel] QueryPoints: [] BlackboxFitted: [] ShapleyValues: [] X: [392×7 table] CategoricalPredictors: [2 5] Method: "interventional-kernel" Intercept: 22.7326 NumSubsets: 64
explainer
stores the training data tbl
in the X
property.
Compute the Shapley values for all observations in tbl
. Speed up computations by using the UseParallel
name-value argument, if you have a Parallel Computing Toolbox™ license.
explainer = fit(explainer,tbl,UseParallel=true);
Starting parallel pool (parpool) using the 'Processes' profile ... 10-Jan-2024 14:09:35: Job Queued. Waiting for parallel pool job with ID 5 to start ... Connected to parallel pool with 6 workers.
For a regression model, shapley
computes Shapley values using the predicted response, and stores them in the ShapleyValues
property. Because explainer
contains Shapley values for multiple query points, display the mean absolute Shapley values instead.
explainer.MeanAbsoluteShapley
ans=6×2 table
Predictor ShapleyValue
______________ ____________
"Acceleration" 0.52233
"Cylinders" 1.0412
"Displacement" 0.80485
"Horsepower" 0.7589
"Model_Year" 0.82285
"Weight" 0.98453
For each predictor, the mean absolute Shapley value is the absolute value of the Shapley values, averaged across all query points. The Cylinders
predictor has the greatest mean absolute Shapley value, and the Acceleration
predictor has the smallest mean absolute Shapley value.
Visualize the Shapley values by using the swarmchart
object function. Specify to use the "copper"
colormap.
swarmchart(explainer,ColorMap="copper")
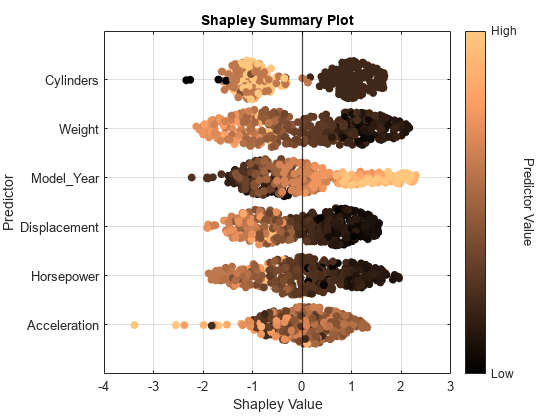
For each predictor, the function displays the Shapley values for the query points. The corresponding swarm chart shows the distribution of the Shapley values. The function determines the order of the predictors by using the mean absolute Shapley values.
Query points with low Weight
values seem to have large positive Shapley values. That is, for these query points, the Weight
predictor contributes to an increase in the MPG
predicted value from the average. Similarly, query points with high Weight
values seem to have large negative Shapley values. That is, for these query points, the Weight
predictor contributes to a decrease in the MPG
predicted value from the average. These results match the idea that car weights are inversely correlated with MPG values.
Input Arguments
explainer
— Object explaining blackbox model
shapley
object
Object explaining the blackbox model, specified as a shapley
object.
queryPoints
— Query points
numeric matrix | table
Query points at which fit
explains predictions,
specified as a numeric matrix or a table. Each row of queryPoints
corresponds to one query point.
For a numeric matrix:
For a table:
If the predictor data
explainer.X
is a table, then all predictor variables inqueryPoints
must have the same variable names and data types as those inexplainer.X
. However, the column order ofqueryPoints
does not need to correspond to the column order ofexplainer.X
.If the predictor data
explainer.X
is a numeric matrix, then the predictor names inexplainer.BlackboxModel.PredictorNames
and the corresponding predictor variable names inqueryPoints
must be the same. To specify predictor names during training, use thePredictorNames
name-value argument. All predictor variables inqueryPoints
must be numeric vectors.queryPoints
can contain additional variables (response variables, observation weights, and so on), butfit
ignores them.fit
does not support multicolumn variables or cell arrays other than cell arrays of character vectors.
If queryPoints
contains NaN
s for continuous
predictors and Method
is "conditional"
, then the
Shapley values (ShapleyValues
) in the returned object are NaN
s. If you
use a regression model that is a Gaussian process regression (GPR), kernel, linear,
neural network, or support vector machine (SVM) model, then fit
returns NaN
Shapley values for query points that contain missing
predictor values or categories not seen during training. For all other models,
fit
handles missing values in the same way as
explainer.BlackboxModel
(that is, the predict
object function of explainer.BlackboxModel
or a function handle
specified by blackbox
).
Before R2024a: You can specify only one query point using a row vector of numeric values or a single-row table.
Example: explainer.X(1,:)
specifies the query point as the first
observation of the predictor data X
in
explainer
.
Data Types: single
| double
| table
Name-Value Arguments
Specify optional pairs of arguments as
Name1=Value1,...,NameN=ValueN
, where Name
is
the argument name and Value
is the corresponding value.
Name-value arguments must appear after other arguments, but the order of the
pairs does not matter.
Example: fit(explainer,q,Method="conditional",UseParallel=true)
computes the Shapley values for the query point q
using the extension to
the Kernel SHAP algorithm, and executes the computation in parallel.
MaxNumSubsets
— Maximum number of predictor subsets
explainer.NumSubsets
(default) | positive integer
Maximum number of predictor subsets to use for Shapley value computation, specified as a positive integer.
For details on how fit
chooses the subsets to use,
see Computational Cost.
This argument is valid when the fit
function uses the Kernel
SHAP algorithm or the extension to the Kernel SHAP algorithm. If you set the
MaxNumSubsets
argument when Method
is
"interventional"
, the software uses the Kernel SHAP algorithm.
For more information, see Algorithms.
Example: MaxNumSubsets=100
Data Types: single
| double
Method
— Shapley value computation algorithm
"interventional"
| "conditional"
Shapley value computation algorithm, specified as
"interventional"
or "conditional"
.
"interventional"
—fit
computes the Shapley values with an interventional value function.fit
offers three interventional algorithms: Kernel SHAP [1], Linear SHAP [1], and Tree SHAP [2]. For each query point, the software selects an algorithm based on the machine learning model
and other specified options. For details, see Interventional Algorithms.explainer
.BlackboxModel"conditional"
—fit
uses the extension to the Kernel SHAP algorithm [3] with a conditional value function.
The Method
property of newExplainer
stores the name of the selected
algorithm. For more information, see Algorithms.
By default, the fit
function uses the algorithm specified in
the Method
property of explainer
.
Before R2023a: You can specify this argument as
"interventional-kernel"
or
"conditional-kernel"
. fit
supports
the Kernel SHAP algorithm and the extension of the Kernel SHAP algorithm.
Example: Method="conditional"
Data Types: char
| string
OutputFcn
— Function called after each query point evaluation
[]
(default) | function handle
Since R2024a
Function called after each query point evaluation, specified as a function handle. An output function can perform various tasks, such as stopping Shapley value computations, creating variables, or plotting results. For details and examples on how to write your own output functions, see Shapley Output Functions.
This argument is valid only when the fit
function computes
Shapley values for multiple query points and the UseParallel
value
is false
.
Data Types: function_handle
UseParallel
— Flag to run in parallel
false
(default) | true
Flag to run in parallel, specified as a numeric or logical
1
(true
) or 0
(false
). If you specify UseParallel=true
, the
fit
function executes for
-loop iterations by
using parfor
. The loop runs in parallel when you
have Parallel Computing Toolbox™.
This argument is valid only when the fit
function computes
Shapley values for multiple query points, or computes Shapley values for one query
point by using the Tree SHAP algorithm for an ensemble of trees, the Kernel SHAP
algorithm, or the extension to the Kernel SHAP algorithm.
Example: UseParallel=true
Data Types: logical
Output Arguments
newExplainer
— Object explaining blackbox model
shapley
object
Object explaining the blackbox model, returned as a shapley
object.
The ShapleyValues
property of the object contains the computed Shapley values.
To overwrite the input argument explainer
, assign the output of
fit
to
explainer
:
explainer = fit(explainer,queryPoints);
More About
Shapley Values
In game theory, the Shapley value of a player is the average marginal contribution of the player in a cooperative game. In the context of machine learning prediction, the Shapley value of a feature for a query point explains the contribution of the feature to a prediction (response for regression or score of each class for classification) at the specified query point.
The Shapley value of a feature for a query point is the contribution of the feature to the deviation from the average prediction. For a query point, the sum of the Shapley values for all features corresponds to the total deviation of the prediction from the average. That is, the sum of the average prediction and the Shapley values for all features corresponds to the prediction for the query point.
For more details, see Shapley Values for Machine Learning Model.
References
[1] Lundberg, Scott M., and S. Lee. "A Unified Approach to Interpreting Model Predictions." Advances in Neural Information Processing Systems 30 (2017): 4765–774.
[2] Lundberg, Scott M., G. Erion, H. Chen, et al. "From Local Explanations to Global Understanding with Explainable AI for Trees." Nature Machine Intelligence 2 (January 2020): 56–67.
[3] Aas, Kjersti, Martin Jullum, and Anders Løland. "Explaining Individual Predictions When Features Are Dependent: More Accurate Approximations to Shapley Values." Artificial Intelligence 298 (September 2021).
Extended Capabilities
Automatic Parallel Support
Accelerate code by automatically running computation in parallel using Parallel Computing Toolbox™.
To run in parallel, set the UseParallel
name-value argument to
true
in the call to this function.
For more general information about parallel computing, see Run MATLAB Functions with Automatic Parallel Support (Parallel Computing Toolbox).
Version History
Introduced in R2021aR2024a: Compute Shapley values for multiple query points
You can now compute Shapley values for multiple query points by using the queryPoints
argument. When working with multiple query points, you can use an output function to perform
various tasks, such as stopping Shapley value computations, creating variables, or plotting
results. To do so, specify the OutputFcn
name-value argument.
R2023b: Interventional Tree SHAP algorithm supports data with missing predictor values
When observations in the input predictor data (
) or values in the query point (explainer
.XqueryPoint
)
contain missing values and the Method
value is
"interventional"
, the fit
function can use the
Tree SHAP algorithm for tree models and ensemble models of tree learners. In previous
releases, under these conditions, the fit
function always used the
Kernel SHAP algorithm for tree-based models. For more information, including cases where the
software still uses Kernel SHAP instead of Tree SHAP for tree-based models, see Interventional Algorithms.
R2023a: fit
supports the Linear SHAP and Tree SHAP algorithms
fit
supports the Linear SHAP [1] algorithm for linear models and the Tree
SHAP [2] algorithm for tree models and ensemble
models of tree learners.
If you specify the Method
name-value argument as
'interventional'
, the fit
function selects an
algorithm based on the machine learning model type of explainer
. The
Method
property
of newExplainer
stores the name of the selected algorithm.
R2023a: Values of the Method
name-value argument have changed
The supported values of the Method
name-value argument have changed
from 'interventional-kernel'
and 'conditional-kernel'
to 'interventional'
and 'conditional'
,
respectively.
MATLAB 命令
您点击的链接对应于以下 MATLAB 命令:
请在 MATLAB 命令行窗口中直接输入以执行命令。Web 浏览器不支持 MATLAB 命令。
Select a Web Site
Choose a web site to get translated content where available and see local events and offers. Based on your location, we recommend that you select: .
You can also select a web site from the following list:
How to Get Best Site Performance
Select the China site (in Chinese or English) for best site performance. Other MathWorks country sites are not optimized for visits from your location.
Americas
- América Latina (Español)
- Canada (English)
- United States (English)
Europe
- Belgium (English)
- Denmark (English)
- Deutschland (Deutsch)
- España (Español)
- Finland (English)
- France (Français)
- Ireland (English)
- Italia (Italiano)
- Luxembourg (English)
- Netherlands (English)
- Norway (English)
- Österreich (Deutsch)
- Portugal (English)
- Sweden (English)
- Switzerland
- United Kingdom (English)