Tune Hover Control Design for VTOL UAV in Steady Wind Condition
This example shows how to tune your control system design for a VTOL UAV in hover configuration in steady wind condition. In the Tune Control Design for VTOL UAV in Hover Configuration example, you have tuned the VTOL UAV for flight in hover configuration. However, you need to update the controller gains for flights with steady wind conditions so that the VTOL UAV can track the desired path and reject the wind disturbances.
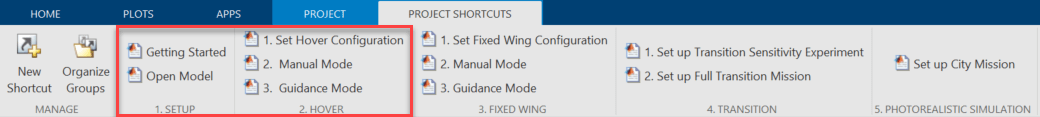
Getting Started
To open the example livescript and directory which contains the Simulink® project file, first run openExample('uav/TuneHoverControlDesignForVTOLUAVInSteadyWindConditionExample') in the Command Window.
You must open the VTOLRefApp.prj project file to access the Simulink model, supporting files, and project shortcuts that this example uses.
% Open the Simulink project
prj = openProject("VTOLApp/VTOLRefApp.prj");
Set up the VTOL UAV plant and enable the hover configuration by clicking the Set up Plant button in the project shortcuts, or run the setupPlant helper function.
setupPlant;
Initialized VTOL model.
Enabled hover configuration.
Enabled hover guidance mission.
Verify Baseline Hover Controller Gains in Steady Wind Condition
The VTOL UAV reference application allows you to use a hover guidance mission to verify the hover controller gains, which ensures that the VTOL UAV is able to follow a more aggressive setpoints during operations in urban environment. During the guidance mission, the Guidance Testbench subsystem calculates the hover controller setpoints based on the mission and the current state of the UAV.
Set up a hover guidance mission that consists of takeoff, waypoint navigation, and landing by clicking Guidance Mode shortcut, or by using the setupHoverGuidanceMission helper function.
setupHoverGuidanceMission;
Enabled hover guidance mission.
Load the gains that you obtained in Tune Control Design for VTOL UAV in Hover Configuration example as the baseline controller gains.
load tunedHoverGainsNoWind.mat;To enable steady wind in the simulation, set the Wind variable to 1. By default, the wind is set at 8 m/s from the east.
Wind = 1;
Disable the visualization subsystem to speed up the simulation.
Visualization = 0;
Run the VTOLTiltrotor model and store the output in outBaseline.
outBaseline = sim(mdl);
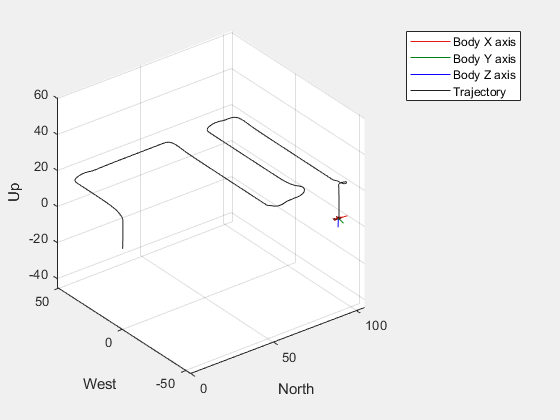
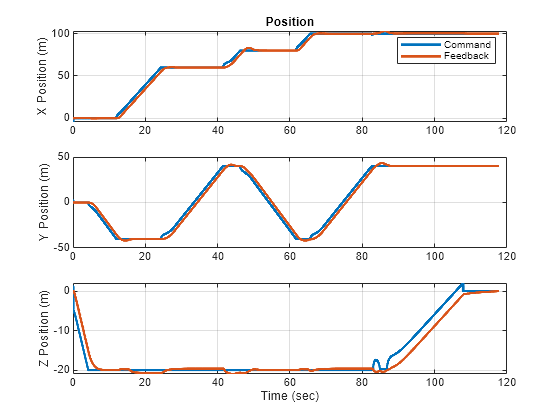
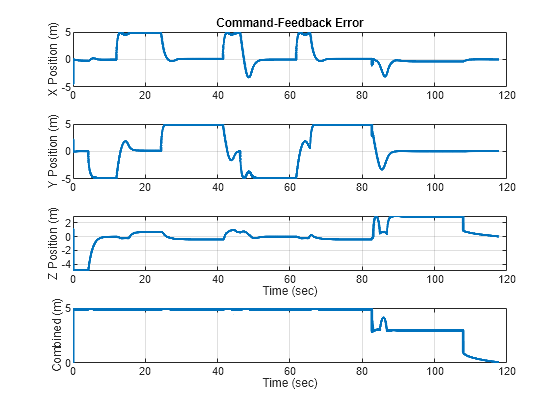
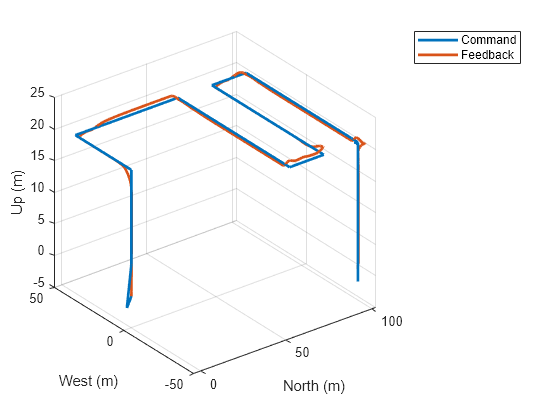
Use the exampleHelperPlotHoverControlTrackingResults helper function to create 2D and 3D plots of the position setpoint and feedback, as well as the position setpoint-feedback error. The plots indicate that compared to the simulation result with no wind, the VTOL UAV has a reduced performance while tracking a complex trajectory in hover with steady wind.
exampleHelperPlotHoverControlTrackingResults(outBaseline);
Automatic Tuning of Hover Controller Gains in Steady Wind Condition
The VTOL UAV hover controller consists of these cascading controller loops:
Attitude rate controller — Inner most loop, consisting of pitch rate, roll rate, and yaw rate PID controller.
Attitude controller — Pitch, roll, and yaw PID controller.
Velocity controller — X, Y, and Z velocity PID controller.
Position controller — Outer most loop, consisting of X, Y, and Z position PID controller.
To improve the hover controller performance, you must adjust the proportional, integral, and derivative gains, along with a filter coefficient, for each controller in the loop. This requires you to tune 48 parameters in total.
The automatic tuning process allows you to obtain the controller gains without having to perform multiple simulations to iterate each of the 48 parameters, which saves you time during the hover controller design process. In this example, the target phase margin for all controllers in the automatic tuning process is 60 degrees to balance between stability and response time.
Before starting the automatic tuning process, you must enable the manual control by clicking Manual Mode under the Hover section in the project, or using the setupHoverManual helper function.
setupHoverManual;
Enabled hover manual testbench mode.
During the autotuning process, the VTOL UAV must be linearized around the hover condition. Reset the hover commands to allow linearization at hover condition.
set_param([mdl '/Manual Control Dashboard/Slider3'],'Value','0');
set_param([mdl '/Manual Control Dashboard/Slider2'],'Value','0');
set_param([mdl '/Manual Control Dashboard/Slider1'],'Value','10');
Run the exampleHelperAutomatedHoverControlTuningWind script to start the automatic tuning process.
During the automatic tuning process, theexampleHelperAutomatedHoverControlTuningWind script performs these operations in each loop, starting from the inner most loop to the outer most loop:
Obtain the linearization input and output points
Linearize the system using
linearizeObtain PID controller gains using
pidtuneWrite the tuned gains to the workspace
exampleHelperAutomatedHoverControlTuningWind;
Verify Tuned Hover Controller Gains in Steady Wind Condition
Verify the hover controller gains that you obtained from the automatic tuning process by using the hover guidance mission.
Set up a hover guidance mission that consists of takeoff, waypoint navigation, and landing by clicking Guidance Mode shortcut, or by using the setupHoverGuidanceMission helper function.
setupHoverGuidanceMission;
Enabled hover guidance mission.
Disable the visualization subsystem to speed up the simulation.
Visualization = 0;
Run the VTOLTiltrotor model and store the output in outTuned.
outTuned = sim(mdl);
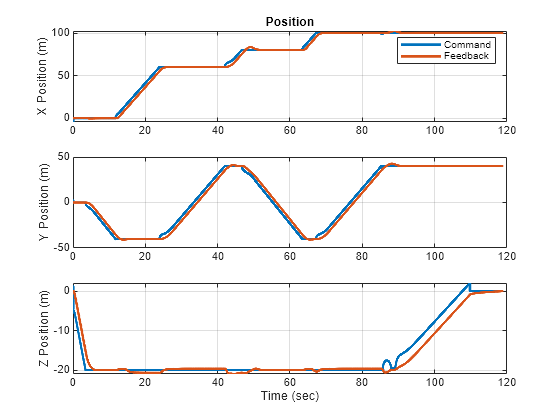
Use the exampleHelperPlotHoverControlTrackingResults helper function to create 2D and 3D plots of the position setpoint and feedback, as well as the position setpoint-feedback error.
exampleHelperPlotHoverControlTrackingResults(outTuned);


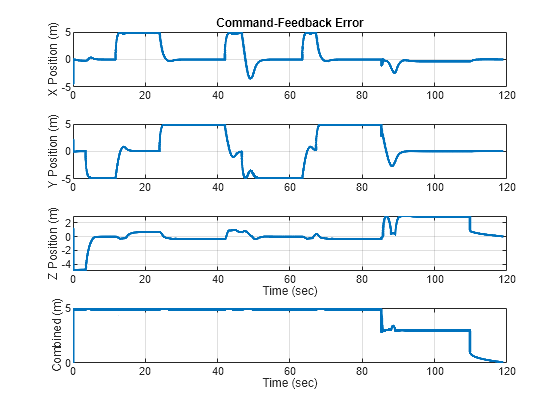
Use the exampleHelperPlotHoverControlTrackingComparison helper function to compare position and position-feedback error between the baseline and autotuned gains. Observe the improved hovering performance of the VTOL UAV against steady wind from the east, as indicated by the reduced overshoot in the y-position error.
exampleHelperPlotHoverControlTrackingComparison(outBaseline,outTuned);
Before resuming to other examples in this example series, you must close the VTOLRefApp.prj Simulink project by running this command in the Command Window:
close(prj)
References
[1] Pavan, N. “Design of Tiltrotor VTOL and Development of Simulink Environment for Flight Simulations.” Indian Institute of Space Science and Technology, 2020
[2] Mathur, Akshay, and Ella M. Atkins. “Design, Modeling and Hybrid Control of a QuadPlane.” Paper presented at AIAA Scitech 2021 Forum, VIRTUAL EVENT. AIAA Scitech 2021 Forum, American Institute of Aeronautics and Astronautics, January 11, 2021. https://doi.org/10.2514/6.2021-0374.
[3] Ducard, Guillaume, and Minh-Duc Hua. “Modeling of an Unmanned Hybrid Aerial Vehicle.” 2014 IEEE Conference on Control Applications (CCA), IEEE, October 2014, 1011–16. https://doi.org/10.1109/CCA.2014.6981467.