detectMSERFeatures
Detect MSER features
Syntax
Description
regions = detectMSERFeatures(I)MSERRegions object,
regions, containing information about MSER features
detected in the 2-D grayscale or binary input image, I. This
object uses Maximally Stable Extremal Regions (MSER) algorithm to find
regions.
Note
For Simulink® support using this function, you must enable the model
configuration settings. To display the dialog box, in the Simulink Editor, select the Modeling tab and then
select Model Settings > Model Properties. In the
Configuration Parameters dialog box, select
Simulation Target > Advanced
Parameters > Dynamic Memory allocation in
MATLAB functions.
[___] = detectMSERFeatures(
sets additional options specified by one or more name-value arguments.I,Name,Value)
Examples
Read image and detect MSER regions.
I = imread('cameraman.tif');
regions = detectMSERFeatures(I);
Visualize MSER regions which are described by pixel lists stored inside the returned 'regions' object.
figure; imshow(I); hold on;
plot(regions,'showPixelList',true,'showEllipses',false);

Display ellipses and centroids fit into the regions. By default, plot displays ellipses and centroids.
figure; imshow(I);
hold on;
plot(regions);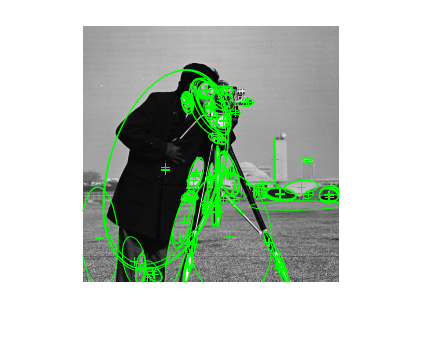
Detect MSER regions.
I = imread('coins.png');
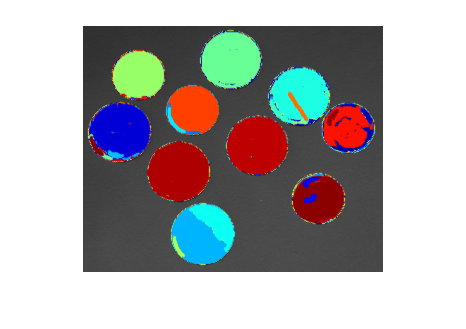
[regions,mserCC] = detectMSERFeatures(I);Show all detected MSER Regions.
figure
imshow(I)
hold on
plot(regions,'showPixelList',true,'showEllipses',false)
Measure the MSER region eccentricity to gauge region circularity.
stats = regionprops('table',mserCC,'Eccentricity');
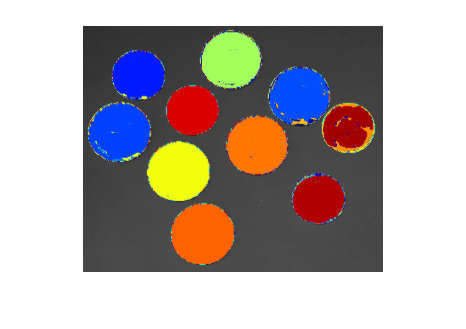
Threshold eccentricity values to only keep the circular regions. (Circular regions have low eccentricity.)
eccentricityIdx = stats.Eccentricity < 0.55;
circularRegions = regions(eccentricityIdx);
Show the circular regions.
figure
imshow(I)
hold on
plot(circularRegions,'showPixelList',true,'showEllipses',false)
Input Arguments
Name-Value Arguments
Output Arguments
Algorithms
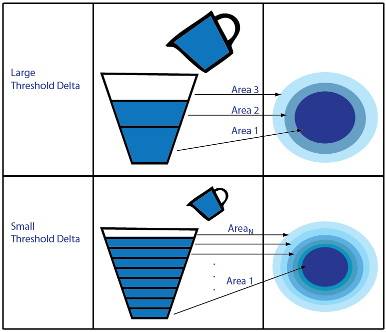
The MSER detector incrementally steps through the intensity range of the input image to detect
stable regions. The ThresholdDelta parameter determines the
number of increments the detector tests for stability. You can think of the
threshold delta value as the size of a cup to fill a bucket with water. The smaller
the cup, the more number of increments it takes to fill up the bucket. The bucket
can be thought of as the intensity profile of the region.
The MSER object checks the variation of the region area size between
different intensity thresholds. The variation must be less than the value of the
MaxAreaVariation parameter to be considered stable.
Note
MSER feature detection is not suitable for use in images with extreme intensity value changes.
At a high level, MSER can be explained, by thinking of the intensity profile of an image representing a series of buckets. Imagine the tops of the buckets flush with the ground, and a hose turned on at one of the buckets. As the water fills into the bucket, it overflows and the next bucket starts filling up. Smaller regions of water join and become bigger bodies of water, and finally the whole area gets filled. As water is filling up into a bucket, it is checked against the MSER stability criterion. Regions appear, grow and merge at different intensity thresholds.
References
[1] Nister, D., and H. Stewenius, "Linear Time Maximally Stable Extremal Regions", Lecture Notes in Computer Science. 10th European Conference on Computer Vision, Marseille, France: 2008, no. 5303, pp. 183–196.
[2] Matas, J., O. Chum, M. Urba, and T. Pajdla. "Robust wide baseline stereo from maximally stable extremal regions." Proceedings of British Machine Vision Conference, pages 384-396, 2002.
[3] Obdrzalek D., S. Basovnik, L. Mach, and A. Mikulik. "Detecting Scene Elements Using Maximally Stable Colour Regions," Communications in Computer and Information Science, La Ferte-Bernard, France; 2009, vol. 82 CCIS (2010 12 01), pp 107–115.
[4] Mikolajczyk, K., T. Tuytelaars, C. Schmid, A. Zisserman, T. Kadir, and L. Van Gool, "A Comparison of Affine Region Detectors"; International Journal of Computer Vision, Volume 65, Numbers 1–2 / November, 2005, pp 43–72.
Extended Capabilities
Version History
Introduced in R2012a
See Also
Functions
detectSURFFeatures|detectMinEigenFeatures|detectBRISKFeatures|detectFASTFeatures|detectHarrisFeatures|detectKAZEFeatures|extractFeatures|extractHOGFeatures|detectFASTFeatures|matchFeatures