rlocusplot
Root locus plot of dynamic system
Description
The rlocusplot function plots the root locus of a dynamic system
model and returns an
RLocusPlot chart object. To customize the plot, modify the properties of
the chart object using dot notation. For more information, see Customize Linear Analysis Plots at Command Line.
To obtain feedback gains and complex root locations, use the rlocus function.
Creation
Syntax
Description
rlp = rlocusplot(sys)sys and
returns the corresponding chart object.
To produce a smooth plot, the rlocusplot function automatically
selects a set of positive feedback gains.
rlp = rlocusplot(___,k)k. You can specify
a frequency range or a vector of frequencies. You can use k with
any of the input argument combinations in previous syntaxes.
rlp = rlocusplot(___,plotoptions)plotoptions. Settings you specify in
plotoptions override the plotting preferences for the current
MATLAB® session.
rlp = rlocusplot(parent,___)Figure or TiledChartLayout, and sets the
Parent property. Use this syntax when you want to create a plot
in a specified open figure or when creating apps in App Designer.
Input Arguments
Properties
Object Functions
addResponse | Add dynamic system response to existing response plot |
Examples
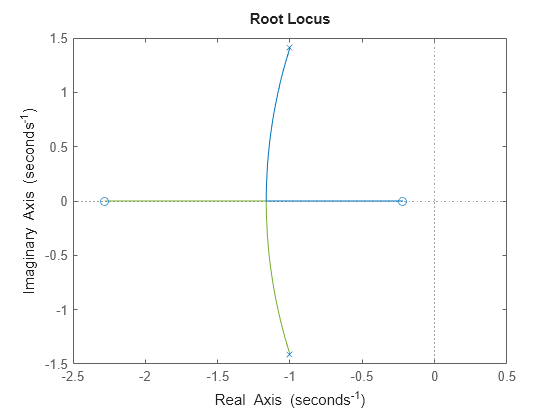
Plot the root locus of a SISO dynamic system model.
sys = tf([2 5 1],[1 2 3]);
rlp = rlocusplot(sys);
More About
Tips
Plots created using
rlocusplotdo not support multiline titles or labels specified as string arrays or cell arrays of character vectors. To specify multiline titles and labels, use a single string with anewlinecharacter.rlocusplot(sys) title("first line" + newline + "second line");