rlocusplot
Root locus plot of dynamic system
Syntax
Description
The rlocusplot function plots the root locus of a dynamic system
model. To customize the plot,
you can return an RLocusPlot object and modify it using dot notation. For
more information, see Customize Linear Analysis Plots at Command Line.
To obtain feedback gains and complex root locations, use the rlocus function.
rlocusplot( plots the root locus of the
SISO dynamic system model sys)sys.
To produce a smooth plot, the rlocusplot function automatically
selects a set of positive feedback gains.
rlocusplot(___, plots
responses for feedback gains specified in k)k. You can specify a
frequency range or a vector of frequencies. You can use k with any of
the input argument combinations in previous syntaxes.
rlocusplot(___,
plots the root locus with the plotting options specified in
plotoptions)plotoptions. Settings you specify in
plotoptions override the plotting preferences for the current
MATLAB® session.
rlocusplot(___,
specifies response properties using one or more name-value arguments. For example,
Name=Value)rlocusplot(sys,MarkerSize=10) sets the pole and zero marker sizes to
10. (since R2026a)
When plotting responses for multiple systems, the specified name-value arguments apply to all responses.
The following name-value arguments override values specified in other input arguments.
FeedbackGainSpec— Overrides frequency values specified usingwColor— Overrides colors specified usingLineSpecMarkerStyle— Overrides marker styles specified usingLineSpecLineStyle— Overrides line styles specified usingLineSpec
rlocusplot( plots the
root locus in the specified parent graphics container, such as a parent,___)Figure
or TiledChartLayout, and sets the Parent property.
Use this syntax when you want to create a plot in a specified open figure or when creating
apps in App Designer.
rlp = rlocusplot(___)
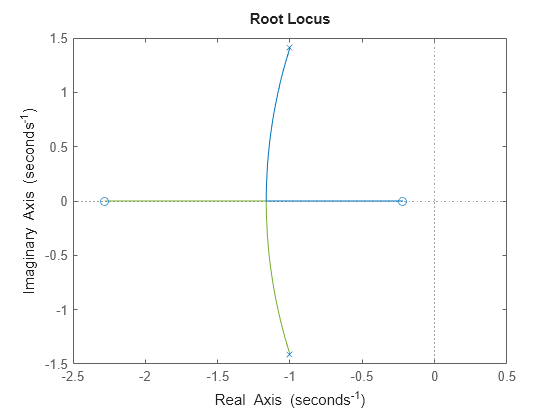
Examples
Plot the root locus of a SISO dynamic system model.
sys = tf([2 5 1],[1 2 3]);
rlp = rlocusplot(sys);