Quantize Semantic Segmentation Network and Generate CUDA Code
This example shows how to quantize a pretrained network for semantic segmentation and generate CUDA® code for deploying the network to a GPU environment.
Semantic segmentation involves labeling each pixel in an image with a class. One application of semantic segmentation is tracking deforestation, which is the change in forest cover over time. Environmental agencies track deforestation to assess and quantify the environmental and ecological health of a region.
Deep learning based semantic segmentation can yield a precise measurement of vegetation cover from high-resolution aerial photographs. To increase classification accuracy, some data sets contain multispectral images that provide additional information about each pixel. For example, the Hamlin Beach State Park data set supplements the color images with three near-infrared channels that provide a clearer separation of the classes.

Neural networks use memory to store input data, parameters (weights), and activations from each layer as the input propagates through the network. Most neural networks that you create and train using Deep Learning Toolbox™ use single-precision floating-point data types. Even small networks require a considerable amount of memory and hardware to perform these floating-point arithmetic operations. These restrictions can inhibit deployment of deep learning models to devices that have low computational power and less memory resources. By using a lower precision to store the weights and activations, you can reduce the memory requirements of the network.
In this example, you use the Deep Learning Toolbox in tandem with the Deep Learning Toolbox Model Compression Library support package to reduce the memory footprint of a deep neural network by quantizing the weights, biases, and activations of convolution layers to 8-bit scaled integer data types. You then quantize the network in MATLAB® and test its performance by simulating quantized inference behavior. Then, you can optionally use GPU Coder™ to generate CUDA code for the optimized network. The generated code takes advantage of NVIDIA® CUDA deep neural network library (cuDNN) or the TensorRT™ high performance inference library. The generated code can be integrated into your project as source code, static or dynamic libraries, or executables that you can deploy to a variety of NVIDIA GPU platforms.
The network in this example is a U-Net, trained to perform semantic segmentation of a multispectral image with seven channels. For more information about semantic segmentation using U-Net, see Semantic Segmentation of Multispectral Images Using Deep Learning (Image Processing Toolbox).
Download Data Set and Trained Network
This example uses the RIT-18 data set which contains high-resolution multispectral image data captured using a drone over the Hamlin Beach State Park, NY [1]. The data contains labeled training, validation, and test sets, with 18 object class labels. The size of the data set is 3.0 GB.
Download the data set as a MAT file using the downloadHamlinBeachMSIData function. This function is attached to the example as a supporting file. To access this file, open the example as a live script. Specify destination as the desired location of the data.
destination = fullfile(pwd);
url = "https://home.cis.rit.edu/~cnspci/other/data/rit18_data.mat";
downloadHamlinBeachMSIData(url,destination);
Downloading Hamlin Beach dataset... This will take several minutes to download... done.
The multispectral image data is arranged as numChannels-by-width-by-height arrays. However, in MATLAB®, multichannel images are arranged as width-by-height-by-numChannels arrays. To reshape the data so that the channels are in the third dimension, use the switchChannelsToThirdPlane function. This function is attached to the example as a supporting file. Load the data set and reshape the images.
load(fullfile(destination,"rit18_data","rit18_data.mat"));

train_data = switchChannelsToThirdPlane(train_data);
val_data   = switchChannelsToThirdPlane(val_data);
test_data = switchChannelsToThirdPlane(test_data);

whos train_data val_data test_data
  Name                Size                     Bytes  Class     Attributes

  test_data       12446x7654x7            1333663576  uint16
  train_data       9393x5642x7             741934284  uint16
  val_data         8833x6918x7             855493716  uint16
Create a vector of class names. This example segments the images into two classes: vegetation and non-vegetation.
classNames = [ "NotVegetation","Vegetation"];
Save the training image data and validation image data as MAT files and the training labels as a PNG file. This facilitates loading the data using imageDatastore and pixelLabelDatastore objects.
save("train_data.mat","train_data");
save("val_data.mat","val_data")
imwrite(train_labels,"train_labels.png");
Download a pretrained U-Net network and inspect some of its layers. The network was trained using single-precision floating-point data.
trainedUnet_url = "https://www.mathworks.com/supportfiles/vision/data/trainedMultispectralUnetModel_v2.zip";
downloadTrainedUnet(trainedUnet_url,destination);
Downloading pretrained network. This can take several minutes to download... Done.
load(fullfile(destination,"trainedMultispectralUnetModel","trainedMultispectralUnetModel_v2.mat"));
net.Layers(1:10)
ans =
  10×1 Layer array with layers:

     1   'encoderImageInputLayer'    Image Input       256×256×6 images with 'zerocenter' normalization
     2   'Encoder-Stage-1-Conv-1'    2-D Convolution   64 3×3×6 convolutions with stride [1  1] and padding 'same'
     3   'Encoder-Stage-1-ReLU-1'    ReLU              ReLU
     4   'Encoder-Stage-1-Conv-2'    2-D Convolution   64 3×3×64 convolutions with stride [1  1] and padding 'same'
     5   'Encoder-Stage-1-ReLU-2'    ReLU              ReLU
     6   'Encoder-Stage-1-MaxPool'   2-D Max Pooling   2×2 max pooling with stride [2  2] and padding [0  0  0  0]
     7   'Encoder-Stage-2-Conv-1'    2-D Convolution   128 3×3×64 convolutions with stride [1  1] and padding 'same'
     8   'Encoder-Stage-2-ReLU-1'    ReLU              ReLU
     9   'Encoder-Stage-2-Conv-2'    2-D Convolution   128 3×3×128 convolutions with stride [1  1] and padding 'same'
    10   'Encoder-Stage-2-ReLU-2'    ReLU              ReLU
The network contains 61 layers in total, 19 of which are 2-D convolution layers.
Use Pretrained Network
This example uses a variation of the U-Net network. In U-Net, the initial series of convolutional layers are interspersed with max pooling layers, successively decreasing the resolution of the input image. These layers are followed by a series of convolutional layers interspersed with upsampling operators, successively increasing the resolution of the input image [2]. The name U-Net comes from the fact that the network can be drawn with a symmetric shape like the letter U.
Before quantizing the network, segment the image using the pretrained U-Net network. The pretrained network was trained using patches of the training image. A supporting function segmentImage is provided at the end of this example and preprocesses the image data to create patches before using those patches for prediction, then assembles the predicted labels from each patch before returning the predicted labels for the entire input image. Use the segmentImage function to segment the validation image using the pretrained network.
origPredictedSegmentedImage = segmentImage(val_data,net);
To extract only the valid portion of the segmentation, multiply the segmented image by the mask channel of the validation data.
origPredictedSegmentedImage = uint8(val_data(:,:,7)~=0) .* origPredictedSegmentedImage;
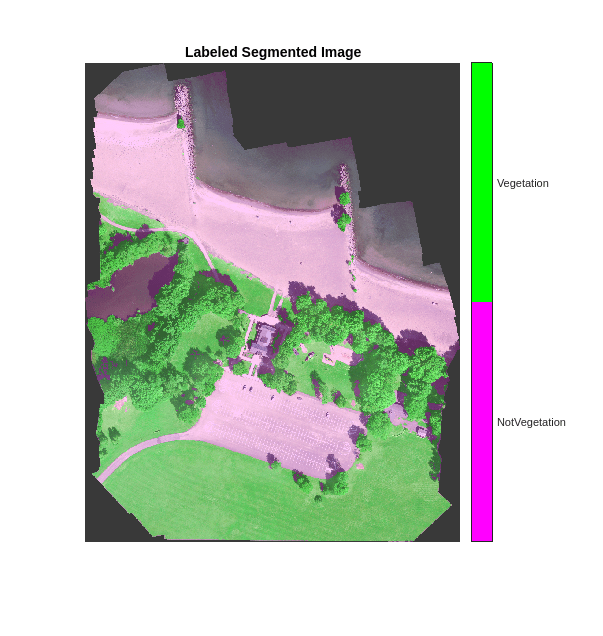
Show the predicted labels overlaid on the validation image.
cmap = [1 0 1;0 1 0];
B = labeloverlay(histeq(val_data(:,:,[3 2 1])),origPredictedSegmentedImage,Transparency=0.8,Colormap=cmap);
figure
imshow(B)
title("Labeled Segmented Image")
N = numel(classNames);
ticks = 1/(N*2):1/N:1;
colorbar(TickLabels=cellstr(classNames),Ticks=ticks,TickLength=0,TickLabelInterpreter="none");
colormap(cmap)

Save the segmented image and ground truth labels as PNG files. The example uses these files to calculate accuracy metrics.
imwrite(origPredictedSegmentedImage,"resultsOrig.png");
imwrite(val_labels,"gtruth.png");
Load the segmentation results and ground truth using pixelLabelDatastore (Computer Vision Toolbox) objects.
pixelLabelIds = 1:2;
pxdsResultsOrig = pixelLabelDatastore("resultsOrig.png",classNames,pixelLabelIds);
pxdsTruth = pixelLabelDatastore("gtruth.png",classNames,pixelLabelIds);
Generate Calibration Result File for the Network
Create a calibration datastore using the training data. Because the MAT file format is a nonstandard image format, you must use a MAT file reader to enable reading the image data. You can use the helper MAT file reader, matReader, that extracts the first six channels from the training data and omits the last channel containing the mask. This function is attached to the example as a supporting file. To access this file, open the example as a live script.
trainImds = imageDatastore("train_data.mat",FileExtensions=".mat",ReadFcn=@matReader);
pxdsTrain = pixelLabelDatastore("train_labels.png",classNames,pixelLabelIds);
calDS = pixelLabelImageDatastore(trainImds,pxdsTrain);
Create a validation datastore.
valImds = imageDatastore("val_data.mat",FileExtensions=".mat",ReadFcn=@matReader);
valDS = pixelLabelImageDatastore(valImds,pxdsTruth);
Create a dlquantizer object for the pretrained network, specifying the ExecutionEnvironment property as GPU.
dq = dlquantizer(net,ExecutionEnvironment="GPU");Collect the dynamic ranges of the weights and biases of the pretrained network using the calibration datastore.
calibrationStatistics = calibrate(dq,calDS)
calibrationStatistics=106×5 table
    'Encoder-Stage-1-Conv-1_Weights'    'Encoder-Stage-1-Conv-1'    "Weights"    -0.7815    0.6391
       'Encoder-Stage-1-Conv-1_Bias'    'Encoder-Stage-1-Conv-1'       "Bias"    -3.4773    2.2645
    'Encoder-Stage-1-Conv-2_Weights'    'Encoder-Stage-1-Conv-2'    "Weights"    -0.2350    0.3092
       'Encoder-Stage-1-Conv-2_Bias'    'Encoder-Stage-1-Conv-2'       "Bias"    -2.0418    2.3351
    'Encoder-Stage-2-Conv-1_Weights'    'Encoder-Stage-2-Conv-1'    "Weights"    -0.2365    0.3039
       'Encoder-Stage-2-Conv-1_Bias'    'Encoder-Stage-2-Conv-1'       "Bias"    -1.2776    1.4744
    'Encoder-Stage-2-Conv-2_Weights'    'Encoder-Stage-2-Conv-2'    "Weights"    -0.1710    0.2984
       'Encoder-Stage-2-Conv-2_Bias'    'Encoder-Stage-2-Conv-2'       "Bias"    -0.7689    1.3898
    'Encoder-Stage-3-Conv-1_Weights'    'Encoder-Stage-3-Conv-1'    "Weights"    -0.1887    0.2391
       'Encoder-Stage-3-Conv-1_Bias'    'Encoder-Stage-3-Conv-1'       "Bias"    -0.9946    0.6503
    'Encoder-Stage-3-Conv-2_Weights'    'Encoder-Stage-3-Conv-2'    "Weights"    -0.1203    0.1713
       'Encoder-Stage-3-Conv-2_Bias'    'Encoder-Stage-3-Conv-2'       "Bias"    -1.3808    1.3048
    'Encoder-Stage-4-Conv-1_Weights'    'Encoder-Stage-4-Conv-1'    "Weights"    -0.1445    0.1371
       'Encoder-Stage-4-Conv-1_Bias'    'Encoder-Stage-4-Conv-1'       "Bias"    -0.5958    0.6824
      ⋮
You can optionally use the validate function to quantize the learnable parameters in the convolution layers of the network, exercise the network, and determine the reduction in learnable parameter memory used. However, the metrics calculated by the validate function differ from those calculated by the evaluateSemanticSegmentation function, as the validate function does not perform patch-wise semantic segmentation by default. To use different metrics for validation, pass a dlquantizationOptions specifying one or more metric functions to the validate function.
validationResults = validate(dq,valDS);
Quantize Network for Simulated Inference in MATLAB
Use the quantize method to quantize the network object and return a simulatable quantized network.
qNet = quantize(dq);
Use the quantizationDetails method to see that the network is now quantized and inspect quantization details.
qDetails = quantizationDetails(qNet)
qDetails = struct with fields:
            IsQuantized: 1
          TargetLibrary: "cudnn"
    QuantizedLayerNames: [41×1 string]
    QuantizedLearnables: [33×3 table]
qDetails.QuantizedLayerNames(1:5)
ans = 5×1 string array
    "Encoder-Stage-1-Conv-1"
    "Encoder-Stage-1-ReLU-1"
    "Encoder-Stage-1-Conv-2"
    "Encoder-Stage-1-ReLU-2"
    "Encoder-Stage-1-MaxPool"
qDetails.QuantizedLearnables
ans=33×3 table
    "Encoder-Stage-1-Conv-1"    "Weights"       3×3×6×64 int8
    "Encoder-Stage-1-Conv-1"       "Bias"       1×1×64 single
    "Encoder-Stage-1-Conv-2"    "Weights"      3×3×64×64 int8
    "Encoder-Stage-1-Conv-2"       "Bias"       1×1×64 single
    "Encoder-Stage-2-Conv-1"    "Weights"     3×3×64×128 int8
    "Encoder-Stage-2-Conv-1"       "Bias"      1×1×128 single
    "Encoder-Stage-2-Conv-2"    "Weights"    3×3×128×128 int8
    "Encoder-Stage-2-Conv-2"       "Bias"      1×1×128 single
    "Encoder-Stage-3-Conv-1"    "Weights"    3×3×128×256 int8
    "Encoder-Stage-3-Conv-1"       "Bias"      1×1×256 single
    "Encoder-Stage-3-Conv-2"    "Weights"    3×3×256×256 int8
    "Encoder-Stage-3-Conv-2"       "Bias"      1×1×256 single
    "Encoder-Stage-4-Conv-1"    "Weights"    3×3×256×512 int8
    "Encoder-Stage-4-Conv-1"       "Bias"      1×1×512 single
      ⋮
You can use the quantized network to emulate how a network quantized for GPU target hardware would perform a semantic segmentation task.
Make predictions using the quantized INT8 network.
predictedSegmentedImage = segmentImage(val_data,qNet);
To extract only the valid portion of the segmentation, multiply the segmented image by the mask channel of the validation data.
predictedSegmentedImage = uint8(val_data(:,:,7)~=0) .* predictedSegmentedImage;
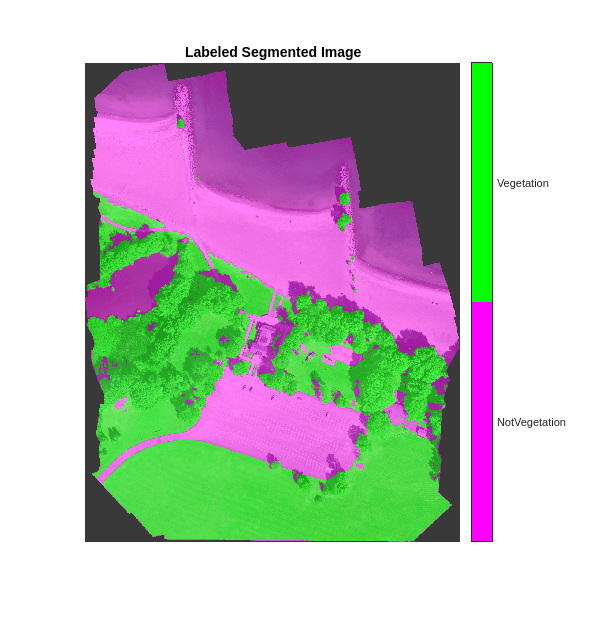
Show the predicted labels overlaid on the validation image.
cmap = [1 0 1;0 1 0];
B = labeloverlay(histeq(val_data(:,:,[3 2 1])),predictedSegmentedImage,Transparency=0.8,Colormap=cmap);
figure
imshow(B)
title("Labeled Segmented Image")
N = numel(classNames);
ticks = 1/(N*2):1/N:1;
colorbar(TickLabels=cellstr(classNames),Ticks=ticks,TickLength=0,TickLabelInterpreter="none");
colormap(cmap);
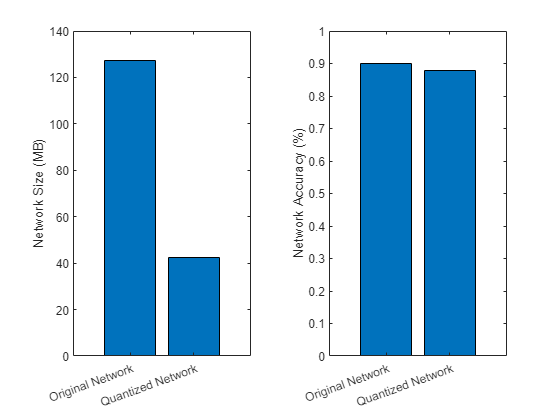
Evaluate the performance of the quantized network, and compare it to the original network. The compareNetworks function is provided at the end of this example, and calculates the global accuracies of the segmented images and plots the global accuracy alongside the size of the original and quantized networks.
imwrite(predictedSegmentedImage,"resultsQuantized.png");
pxdsResultsQuantized = pixelLabelDatastore("resultsQuantized.png",classNames,pixelLabelIds);
metrics = compareNetworks(dq,pxdsResultsOrig,pxdsResultsQuantized,pxdsTruth,valDS);
Generate CUDA Code
Generate CUDA code based on the quantized network (optional).
Create an Entry-Point Function for Code Generation
An entry-point function is a top-level MATLAB function from which you generate code. Write an entry-point function in MATLAB that:
Uses the
coder.loadDeepLearningNetworkfunction to load a deep learning model and to construct and set up a CNN class. For more information, see Load Pretrained Networks for Code Generation (GPU Coder).Calls the
activationsfunction to predict the responses.
The entry-point function segnet_predictor is provided as a supporting file with this example. To access this file, open the example as a live script.
Generate Code
Save the dlquantizer object and add the folder containing the trained network to the MATLAB path.
save("dq_afterVal.mat","dq")
addpath(fullfile(destination,"trainedMultispectralUnetModel"))
To configure build settings such as output file name, location, and type, create a coder configuration object. To create the object, use the coder.gpuConfig function and specify that a MEX file is output from generated CUDA code.
cfg = coder.gpuConfig("mex");Set the language to use in the generated code to C++.
cfg.TargetLang = "C++";To specify code generation parameters for cuDNN, set the DeepLearningConfig property to a coder.CuDNNConfig object using coder.DeepLearningConfig.
cfg.DeepLearningConfig = coder.DeepLearningConfig("cudnn");Set the inference computation precision to 8-bit integer.
cfg.DeepLearningConfig.DataType = "int8";Use the dlquantizer object to generate the quantized network using the design file segnet_predictor.m. The generated segnet_predictor_mex function returns the predicted labels of the input patch data using the quantized network.
cfg.DeepLearningConfig.CalibrationResultFile = "dq_afterVal.mat";
codegen -config cfg segnet_predictor -args {ones(256,256,6,"single")} -report
Code generation successful: View report
You can view the resulting code generation report by clicking View Report in the MATLAB Command Window. The report is displayed in the Report Viewer window. If the code generator detects errors or warnings during code generation, the report describes the issues and provides links to the problematic MATLAB code.
Run the Generated MEX Code
To perform semantic segmentation using the generated MEX code, call the segmentImage function and pass the generated MEX function as a function handle.
predictedSegmentedImageCodegen = segmentImage(val_data,@(x) segnet_predictor_mex(x));
To extract only the valid portion of the segmentation, multiply the segmented image by the mask channel of the validation data.
predictedSegmentedImageCodegen = uint8(val_data(:,:,7)~=0) .* predictedSegmentedImageCodegen;
Show the predicted labels overlaid on the validation image.
cmap = [1 0 1;0 1 0];
B = labeloverlay(histeq(val_data(:,:,[3 2 1])),predictedSegmentedImageCodegen,Transparency=0.5,Colormap=cmap);
figure
imshow(B)
title("Labeled Segmented Image")
N = numel(classNames);
ticks = 1/(N*2):1/N:1;
colorbar(TickLabels=cellstr(classNames),Ticks=ticks,TickLength=0,TickLabelInterpreter="none");
colormap(cmap);
Compute the performance metrics of the predicted labels.
imwrite(predictedSegmentedImageCodegen,"resultsQuantizedCodegen.png");
pxdsResultsQuantizedCodegen = pixelLabelDatastore("resultsQuantizedCodegen.png",classNames,pixelLabelIds);

ssmQuantizedCodegen = evaluateSemanticSegmentation(pxdsResultsQuantizedCodegen,pxdsTruth,Metrics="global-accuracy");
Evaluating semantic segmentation results
----------------------------------------
* Selected metrics: global accuracy.
* Processed 1 images.
* Finalizing... Done.
* Data set metrics:

    GlobalAccuracy
    ______________

        0.9638
References
[1] Kemker, R., C. Salvaggio, and C. Kanan. "High-Resolution Multispectral Dataset for Semantic Segmentation." CoRR, abs/1703.01918. 2017.
[2] Ronneberger, O., P. Fischer, and T. Brox. "U-Net: Convolutional Networks for Biomedical Image Segmentation." CoRR, abs/1505.04597. 2015.
Supporting Functions
segmentImage
The segmentImage function performs patch-wise semantic segmentation on an input multispectral image im using a network net. The network net can be a dlnetwork object or a function handle. The function performs semantic segmentation using the activations function.
function out = segmentImage(im,net)

% Set patch size and preallocate array of patches.
patchSize = [256,256];
[height,width,nChannel] = size(im);
patch = zeros([patchSize,nChannel-1],like=im);

% Pad image to have dimensions that are multiples of patch size.
padSize = zeros(1,2);
padSize(1) = patchSize(1) - mod(height,patchSize(1));
padSize(2) = patchSize(2) - mod(width,patchSize(2));
im_pad = padarray(im,padSize,0,"post");
[height_pad,width_pad,~] = size(im_pad);

% Preallocate output array.
out = zeros([size(im_pad,1),size(im_pad,2)],"uint8");

for i = 1:patchSize(1):height_pad

    for j =1:patchSize(2):width_pad


        % Extract patch from padded image.
        for p = 1:nChannel-1
            patch(:,:,p) = squeeze(im_pad(i:i+patchSize(1)-1, ...
                j:j+patchSize(2)-1, ...
                p));
        end
        Iroi = single(patch);


        % Perform semantic segmentation.
        if isa(net,"function_handle")
            fcnPredict = net;
            allScores = fcnPredict(Iroi);
        else
            layerName = "FinalNetworkSoftmax-Layer";
            allScores = predict(net,Iroi,Outputs=layerName);
        end

        [~, L] = max(allScores,[],3);

            if isdlarray(L) == 1

                 Lroi = uint8(extractdata(L));
            else
                 Lroi = uint8(L);

            end

        % Remove singleton channel dimension.
        patch_seg = squeeze(Lroi);

        % Add predictions to output.
        out(i:i+patchSize(1)-1,j:j+patchSize(2)-1) = patch_seg;

    end
end

% Remove the padding.
out = out(1:height,1:width);
end
compareNetworks
The compareNetworks function calculates the global accuracy of the segmented images by using the evaluateSemanticSegmentation (Computer Vision Toolbox) function to compare them against the ground truth. The global accuracy is the ratio of correctly classified pixels, regardless of class, to the total number of pixels.
function metrics = compareNetworks(dq,pxdsResultsOrig,pxdsResultsQuantized,pxdsTruth,valDS)

% Compute global accuracy.
ssmOrig = evaluateSemanticSegmentation(pxdsResultsOrig,pxdsTruth,Metrics="global-accuracy",Verbose=false);
ssmQuantized = evaluateSemanticSegmentation(pxdsResultsQuantized,pxdsTruth,Metrics="global-accuracy",Verbose=false);

% Store the results in a struct.
metrics.OriginalNetwork.GlobalAccuracy = ssmOrig.ImageMetrics.GlobalAccuracy;
metrics.QuantizedNetwork.GlobalAccuracy = ssmQuantized.ImageMetrics.GlobalAccuracy;

% Compute the size of the network before and after quantization.
% As the performance of the network has already been calculated, skip calculating metrics by setting the metric function to [].
quantOpts = dlquantizationOptions('target','gpu',MetricFcn=@(x) []);
validationResults = validate(dq,valDS,quantOpts);

% Store the results in a struct.
metrics.OriginalNetwork.Sizekb = validationResults.Statistics{1,2};
metrics.QuantizedNetwork.Sizekb = validationResults.Statistics{2,2};


% Plot the size in memory and the global accuracy of the networks.
figure
tiledlayout(1,2)

nexttile
bar(categorical(["Original Network","Quantized Network"]),[metrics.OriginalNetwork.Sizekb/1e6,metrics.QuantizedNetwork.Sizekb/1e6])
ylabel("Network Size (MB)")
xtickangle(20)

nexttile
bar(categorical(["Original Network","Quantized Network"]), ...
    [metrics.OriginalNetwork.GlobalAccuracy,metrics.QuantizedNetwork.GlobalAccuracy])
ylabel("Network Accuracy (%)")
ylim([0 1])
xtickangle(20)

end