可视化 LSTM 网络的激活值
此示例说明如何通过提取激活值来调查和可视化 LSTM 网络学习到的特征。
加载预训练网络。JapaneseVowelsNet 是基于日语元音数据集训练的预训练 LSTM 网络,如 [1] 和 [2] 中所述。它是基于按序列长度排序的序列训练的,小批量大小为 27。
load JapaneseVowelsNet查看网络架构。
net.Layers
ans =
  4×1 Layer array with layers:

     1   'sequenceinput'   Sequence Input    Sequence input with 12 channels
     2   'lstm'            LSTM              LSTM with 100 hidden units
     3   'fc'              Fully Connected   Fully connected layer with output size 9
     4   'softmax'         Softmax           Softmax
加载测试数据。
load JapaneseVowelsTestData在绘图中可视化第一个时间序列。每行对应一个特征。
X = XTest{1};

figure
plot(XTest{1}')
xlabel("Time Step")
title("Test Observation 1")
numFeatures = size(XTest{1},1);
legend("Feature " + string(1:numFeatures),'Location',"northeastoutside")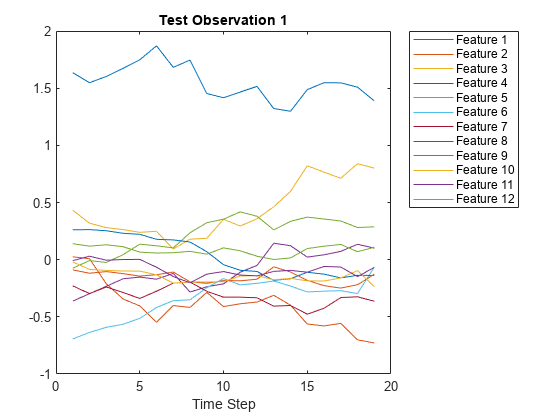
对于序列的每个时间步,获取 LSTM 层(第 2 层)在该时间步的激活值输出,并更新网络状态。
sequenceLength = size(X,2);
idxLayer = 2;
outputSize = net.Layers(idxLayer).NumHiddenUnits;

for i = 1:sequenceLength
    [features(i,:),state] = predict(net,X(:,1)',Outputs="lstm");
    net.State = state;
end
features = features';
使用热图可视化前 10 个隐藏单元。
figure
heatmap(features(1:10,:));
xlabel("Time Step")
ylabel("Hidden Unit")
title("LSTM Activations")

该热图显示每个隐藏单元激活的强度,并突出显示激活值随时间的变化情况。
参考
[1] M. Kudo, J. Toyama, and M. Shimbo. "Multidimensional Curve Classification Using Passing-Through Regions." Pattern Recognition Letters. Vol. 20, No. 11–13, pages 1103–1111.
[2] UCI Machine Learning Repository: Japanese Vowels Dataset. https://archive.ics.uci.edu/ml/datasets/Japanese+Vowels
另请参阅
trainnet | trainingOptions | dlnetwork | predict | forward | lstmLayer | bilstmLayer | sequenceInputLayer