addRays
Description
Add-On Required: This feature requires the Optical Design and Simulation Library for Image Processing Toolbox add-on.
addRays( traces rays through the optical
system in the visualization osv)osv. The addRays
function traces rays from the field points specified by the FieldPoints
property of the opticalSystem
object at the wavelengths specified by Wavelengths
property of the opticalSystem
object.
addRays(
specifies visualization properties for the rays using one or more optional name-value
arguments. For example, osv,rays,Name=Value)Color="red" renders rays added to the optical
system chart in red.
Examples
Create a simple optical system.
opsys = opticalSystem;
addRefractiveSurface(opsys,Radius=9,Material=[1.74 25.4],DistanceToNext=3)
addRefractiveSurface(opsys,Radius=-9,DistanceToNext=10)
addImagePlane(opsys)
focus(opsys);
Visualize the optical system in 2-D.
osv2d = view2d(opsys,Title="Convex Lens")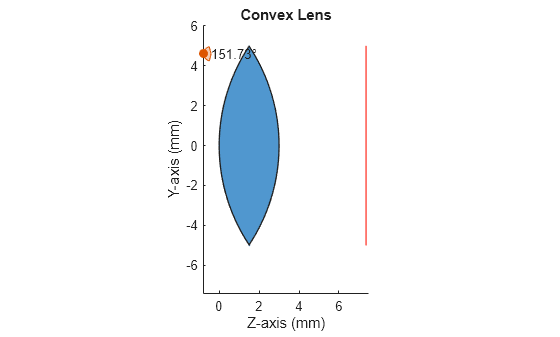
osv2d =
  OpticalSystemViewer2D with properties:

            Title: "Convex Lens"
    OpticalSystem: [1×1 opticalSystem]
           Labels: "none"
      FieldPoints: "on"
             Rays: [0×0 optics.ui.Rays2D]
           Parent: [1×1 Figure]

  Show all properties
Trace rays in the optical system to add to the visualization. Observe that rays contains three ray bundles.
rays = traceRays(opsys)
rays=1×3 RayBundle array with properties:
    FieldPoint
    Wavelength
    Sampling
    RayData
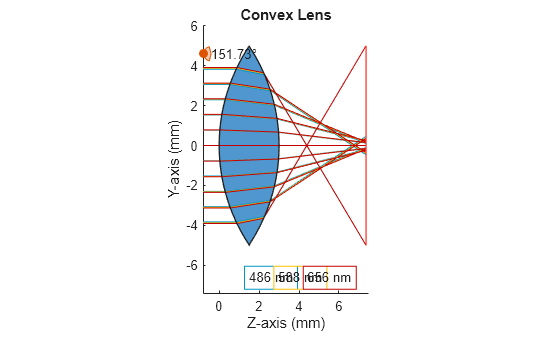
Add the rays to the visualization. Each ray bundle is represented by a different color in the visualization.
addRays(osv2d,rays)
Remove the third ray bundle in the visualization.
removeRays(osv2d,3)

Add component labels to the visualization. The lens and image plane components are labeled as C1 and C2 in the visualization.
osv2d.Labels = "component";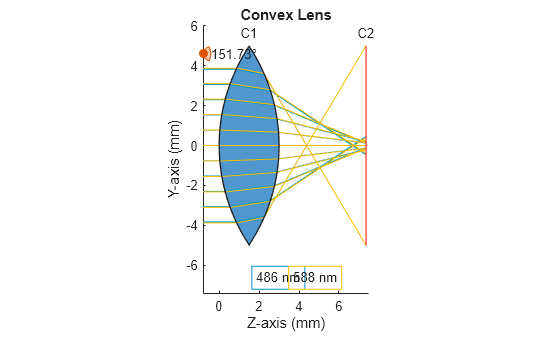
Create a simple optical system.
opsys = opticalSystem;
addRefractiveSurface(opsys,Radius=9,Material=[1.74 25.4],DistanceToNext=3)
addRefractiveSurface(opsys,Radius=-9,DistanceToNext=10)
addImagePlane(opsys)
Visualize the optical system in 3-D.
osv3d = view3d(opsys,Title="Convex Lens")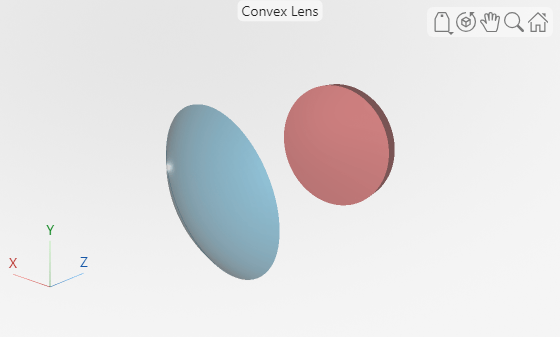
osv3d =
  OpticalSystemViewer3D with properties:

              Title: [0×0 string]
             Labels: "none"
          ClipAngle: 0
               Rays: [0×0 optics.ui.Rays3D]
    BackgroundColor: [0.9608 0.9608 0.9608]
      GradientColor: [0.9020 0.9020 0.9020]
             Parent: [1×1 Figure]

  Show all properties
Trace rays in the optical system to add to the visualization. Observe that rays contains three ray bundles.
rays = traceRays(opsys)
rays=1×3 RayBundle array with properties:
    1×1 RayBundle    1×1 RayBundle    1×1 RayBundle
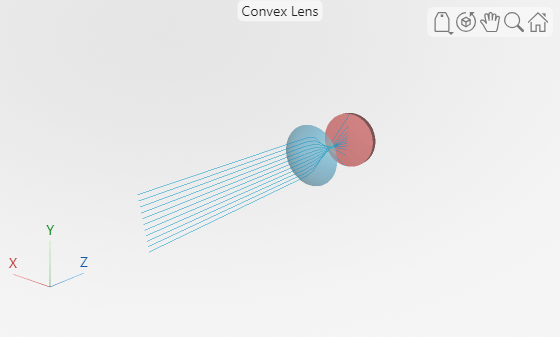
You can add only one ray bundle to a 3-D visualization. Add one of the ray bundles from the traced rays to the visualization.
addRays(osv3d,rays(1))
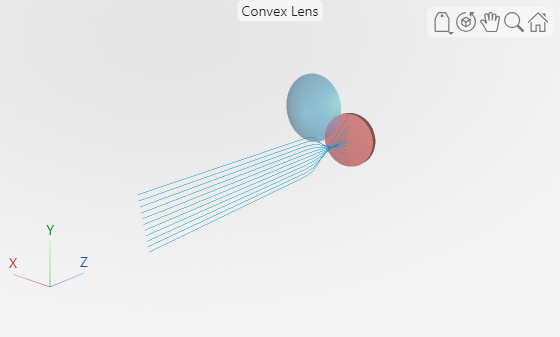
Explode the visualization. The explosion moves each component in the optical system visualization radially outward to enable you to better visualize the internal structure of the optical system.
explode(osv3d)
Restore the visualization to its state before the explosion.
unexplode(osv3d)

Show only the lens element, which is the first optical component, in the visualization.
showComponents(osv3d,1)
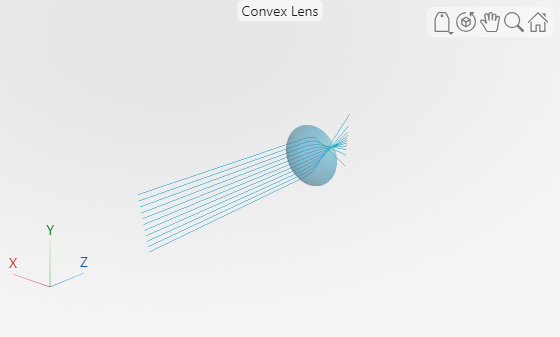
Remove the rays from the visualization.
removeRays(osv3d)

Add component labels to the visualization.
osv3d.Labels = "component";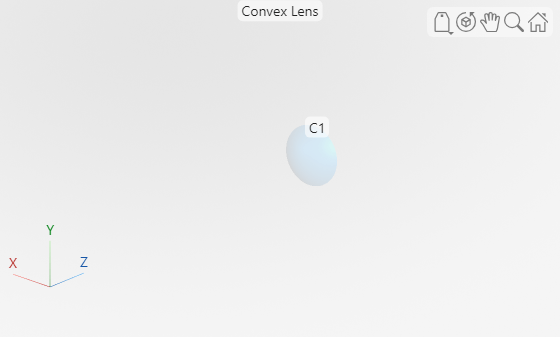
Input Arguments
Name-Value Arguments
Specify optional pairs of arguments as
Name1=Value1,...,NameN=ValueN, where Name is
the argument name and Value is the corresponding value.
Name-value arguments must appear after other arguments, but the order of the
pairs does not matter.
Example: addRays(osv,rays,Color="red") renders rays added to the
visualization chart osv in red.
Ray color, specified as an RGB triplet, a hexadecimal color code, one of the color options listed in the table, a vector of RGB triplets, a vector of hexadecimal color codes, or a vector of color options listed in the table.
The number of colors you can specify depends on the optical system visualization. By default, the function uses colors based on the wavelength of the ray bundle.
For a 2-D visualization, when
osvis anOpticalsystemViewer2Dobject, specify a single color for all the ray bundles or a vector of colors with one color for each ray bundle.For a 3-D visualization, when
osvis anOpticalsystemViewer3Dobject, specify a single color because you can add only a singleRayBundleobject to anOpticalsystemViewer3Dobject.
For a custom color, specify an RGB triplet or a hexadecimal color code.
An RGB triplet is a three-element row vector whose elements specify the intensities of the red, green, and blue components of the color. The intensities must be in the range
[0,1], for example,[0.4 0.6 0.7].A hexadecimal color code is a string scalar or character vector that starts with a hash symbol (
#) followed by three or six hexadecimal digits, which can range from0toF. The values are not case sensitive. Therefore, the color codes"#FF8800","#ff8800","#F80", and"#f80"are equivalent.
Alternatively, you can specify some common colors by name. This table lists the named color options, the equivalent RGB triplets, and the hexadecimal color codes.
| Color Name | Short Name | RGB Triplet | Hexadecimal Color Code | Appearance |
|---|---|---|---|---|
"red" | "r" | [1 0 0] | "#FF0000" |
|
"green" | "g" | [0 1 0] | "#00FF00" |
|
"blue" | "b" | [0 0 1] | "#0000FF" |
|
"cyan"
| "c" | [0 1 1] | "#00FFFF" |
|
"magenta" | "m" | [1 0 1] | "#FF00FF" |
|
"yellow" | "y" | [1 1 0] | "#FFFF00" |
|
"black" | "k" | [0 0 0] | "#000000" |
|
"white" | "w" | [1 1 1] | "#FFFFFF" |
|
"none" | Not applicable | Not applicable | Not applicable | No color |
Transparency of rays in the 3-D visualization, specified as a numeric scalar in
the range [0, 1]. You can specify this argument only when osv is
an OpticalsystemViewer3D object. Changing the transparency of the
rays can improve your visualization. Specify a higher value for more opaque rays. A
higher value of Alpha is suitable when the number of rays is small.
Specify a lower value for more transparent rays. A lower value of
Alpha is suitable when the number of rays is large and can block
other rays in the visualization.
If the number of rays in
raysis less than 10 , the default value ofAlphais1.If the number of rays in
raysis greater than 250 , the default value ofAlphais0.2.If the number of rays in
raysis in the range [10,250] , the default value ofAlphafalls linearly from1to0.2.
Data Types: single | double | int8 | int16 | int32 | int64 | uint8 | uint16 | uint32 | uint64
Version History
Introduced in R2026a
See Also
OpticalSystemViewer2D | OpticalSystemViewer3D | removeRays | explode | restore | showComponents